. 2014 Jun 1;192(11):5098-108.
doi: 10.4049/jimmunol.1303073. Epub 2014 Apr 30.

All-trans retinoic acid induces arginase-1 and inducible nitric oxide synthase-producing dendritic cells with T cell inhibitory function

Affiliations

All-trans retinoic acid induces arginase-1 and inducible nitric oxide synthase-producing dendritic cells with T cell inhibitory function

Sumantha Bhatt et al. J Immunol. .

Abstract

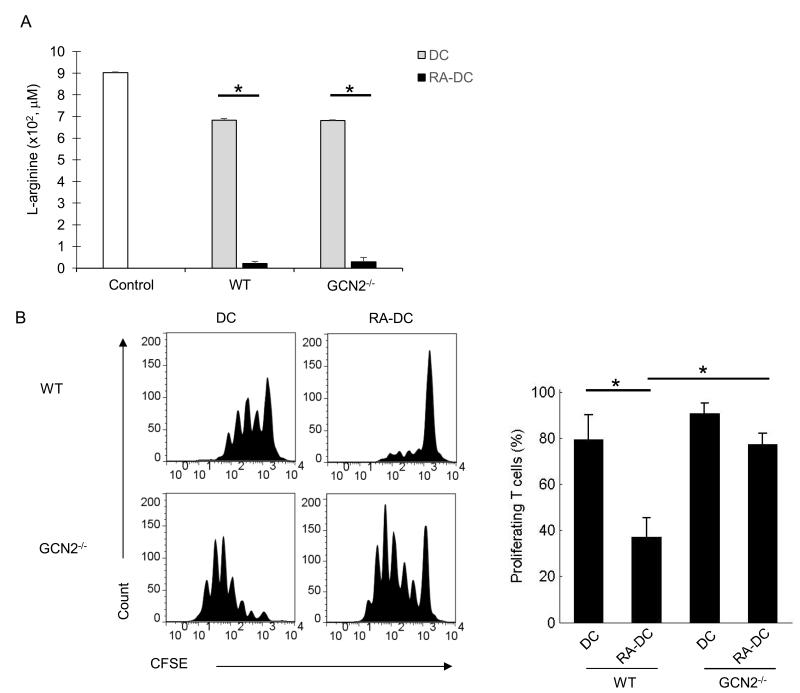
Hepatic stellate cells (HSC) are a major source of the immunoregulatory metabolite all-trans retinoic acid (ATRA), which may contribute to the generation of tolerogenic dendritic cells (DCs) in the liver. The present study seeks to clarify the mechanism(s) through which ATRA promotes the development of tolerogenic DCs. Although bone marrow-derived ATRA-treated DCs (RA-DCs) and conventional DCs had comparable surface phenotype, RA-DCs had diminished stimulatory capacity and could directly inhibit the expansion of DC/OVA-stimulated OT-II T cells. Arginase-1 (Arg-1) was found promote suppression because 1) ATRA was a potent inducer of Arg-1 protein and activity, 2) the Arg-1 inhibitor N(w)-hydroxy nor-l-arginine partially reversed suppression, and 3) the suppressive function of RA-DCs was partially compromised using OT-II T cells from GCN2(-/-) mice, which are insensitive to Arg-1. Inducible NO synthase (iNOS), however, was found to be a more significant contributor to RA-DC function because 1) ATRA potentiated the expression of IFN-γ-induced iNOS, 2) suppressive function in RA-DCs was blocked by the iNOS inhibitor N(G)-monomethyl-l-arginine, monoacetate salt, and 3) RA-DCs derived from iNOS(-/-) mice exhibited near complete loss of tolerogenic function, despite sustained Arg-1 activity. The expression of iNOS and the suppressive function of RA-DCs were dependent on both IFN-γ and ATRA. Furthermore, the in vivo behavior of RA-DCs proved to be consistent with their in vitro behavior. Thus, we conclude that ATRA enhances both Arg-1 and iNOS expression in IFN-γ-treated DCs, resulting in a tolerogenic phenotype. These findings elucidate mechanisms through which ATRA may contribute to liver immune tolerance.


Figures

FIGURE 1
FIGURE 1
Comparison of surface molecules and stimulatory capacity of RA-DCs and DCs. (A) DCs and RA-DCs were stained for CD11b and the following markers: CD11c, I-Ab, and CD86 and analyzed by FACs. Cells were gated on CD11b+ cells and the respective marker and compared in the form of histograms. The shaded gray lines indicate isotype controls and the black/dotted lines indicate stained cells. Data representative of three experiments. (B) T cells purified from OT-II TCR transgenic mice (0.2×10⁶/well) were labeled with CFSE and cultured with DCs or RA-DCs at a ratio of (1:10, DC/RA-DC: T) in the presence of OVA protein (100 μg/mL) for three days. Proliferating OT-II T cells were measured by FACs, in which cells were gated on live CFSE+ lymphocytes expressing CD4. A representative histogram is provided in addition to a bar graph displaying the mean percentages of dividing CD4+ T lymphocytes + SE from seven independent experiments. (C) OT-II T cells were cultured with DCs or RA-DCs which had been pulsed with either OVA protein or OVA323–339 peptide for three days. Live CFSE+, CD4+ T cells were gated and division was analyzed by FACs. Shown are a representative histogram and the mean percentages of dividing CD4+ T lymphocytes + SE from five independent experiments. *p < 0.05
FIGURE 2
FIGURE 2
RA-DCs can inhibit the proliferation of activated OT-II T cells. (A) CFSE labeled OT-II T cells (0.2×10⁶/well) were co-cultured with DCs (1:20, DC:T) and OVA protein. Additional DCs or RA-DCs were added as regulators (1:10, DC/RA-DC:T). Live CFSE+, CD4+ T cells were gated and division was analyzed by FACs. The data show a representative histogram and the mean percentages of dividing CD4+ T cells + SE from ten independent experiments. (B) OT-II T cells were co-cultured with DCs (1:20, DC:T), which had been pulsed with OVA protein (18hrs), and additional OVA-pulsed DCs or RA-DCs added as regulators (1:10, DC/RA-DC:T). Proliferation was analyzed after three days. The data show a representative histogram and the mean percentages of proliferating CD4+ T cells + SE from five independent experiments. (C) OT-II T cells were purified and labeled with CFSE and added to plates coated overnight with anti-CD3 Ab (1μg/mL). DCs or RA-DCs were added (1:10, DC/RA-DC:T) in the presence of anti-CD28 Ab (1ug/mL). Cells were cultured for three days. Proliferation was measured via CFSE dilution and FACs analysis. A representative histogram and the mean percentages of proliferating CD4+ T cells + SE from three experiments are presented. (D) OT-II T cells from DC-OT-II and RA-DC-OT-II co-culture experiments were stained for IFN-γ and analyzed by FACs. Data representative of three experiments. The IFN-γ data shown here corresponds with the same experiment in which T cell proliferation was measured (Fig. 2A). *p < 0.05
FIGURE 3
FIGURE 3
ATRA is a potent inducer of Arg-1 expression in BM-DCs. (A) BM cells were propagated in GM-CSF (10 ng/mL) with or without IL-4 (1000 U/mL) and/or ATRA (100 nM) and cultured for five days. BM lysates were analyzed for Arg-1 expression by Western blotting. GAPDH was used as a loading control. Data representative of at least seven experiments. (B) BM cells were cultured with GM-CSF (10 ng/mL) and IL-4 (1000 U/mL), with or without ATRA (100 nM) and/or LE-135 (1 μM) for five days. BM lysates were analyzed for Arg-1 expression by Western blotting. GAPDH was used as a loading control. Data representative of three experiments. (C) RA-DC-derived Arg-1 significantly reduces L-arginine levels in supernatants of RA-DC-T-cell co-cultures. The concentration of L-arginine in supernatants of DC/RA-DC-T cell co-cultures was measured at 24, 48 and 72 h by HPLC. Control indicates complete RPMI medium. Data show mean + SE of three independent experiments. *p < 0.05
FIGURE 4
FIGURE 4
Inhibition of Arg-1 activity reduces RA-DC suppressive capacity. (A) Purified, CFSE labeled OT-II T cells were set up as in Figure 2A. The arginase inhibitor nor-NOHA (300 μM) was added to DC/RA-DC-T cell co-cultures. T cell proliferation was assessed thorough FACs. (B) Excess L-arginine (3 mM) was added to DC/RA-DC-T cell co-cultures and proliferation was analyzed by FACs. A representative histogram and the mean percentages of proliferating CD4+ T cells + SE from three independent experiments, with DC controls, are provided. *p < 0.05
FIGURE 5
FIGURE 5
Suppression by RA-DCs is GCN2 dependent. (A) T cells were isolated from WT OT-II mice and GCN2−/− OT-II mice, labeled with CFSE, and used as responders in DC/OVA protein (1:20, DC:T) plus DC/RA-DC (1:10, DC/RA-DC:T) co-cultures. Supernatants were harvested at 72 h and L-arginine levels were analyzed by HPLC. Control indicates complete RPMI medium. Data show the mean + SE of three independent experiments. (B) T cell proliferation was assessed by FACs. Shown are a representative histogram and the mean percentages of proliferating CD4+ T cells + SE from three independent experiments. *p < 0.05
FIGURE 6
FIGURE 6
RA-DC mediated suppression is highly dependent on iNOS. (A) RA-DC and DC cultures were prepared from BM cells cultured in the presence of GM-CSF (10 ng/mL) and IL-4 (1000 U/mL) with or without ATRA (100 nM), respectively. After five days of culture, DCs and RA-DCs were stimulated with IFN-γ for 24 h. Cell lysates were analyzed for iNOS expression by Western blotting. GAPDH was used as a loading control. Data is representative of three experiments. (B) iNOS activity was inhibited by administration of L-NMMA (300 μM) into RA DC-T cell co-cultures (set up as described in Figure 2A). Proliferation was determined by FACs analysis. (C) DCs and RA-DCs were prepared from WT and iNOS−/− mice (as indicated in Figure 6A). CFSE labeled OT-II T cells (0.2×10⁶/well) were cultured with DCs/OVA (1:20, DC:T) and WT or iNOS−/− DCs/RA-DCs (1:10, DC/RA-DC:T) for three days. (D) nor-NOHA (300 μM) was added into WT or iNOS−/− DC/RA-DC-T cell co-cultures (as set up in Figure 6C). Proliferation was measured after three days by CFSE dilution and FACs analysis. All proliferation data show a representative histogram and the mean + SE from three independent experiments. *p < 0.05
FIGURE 7
FIGURE 7
IFN-γ signaling is required for iNOS expression and RA-DC mediated suppressive function. (A) DCs and RA-DCs were prepared from the bone marrow of WT and IFN-γR1−/− mice (as indicated in Figure 6A). WT and IFN-γR1−/− DCs and RA-DCs were stimulated with IFN-γ for 24 h. Cell lysates were analyzed for iNOS expression by Western blotting. GAPDH was used as a loading control. Data representative of three experiments. (B) WT or IFN-γR1−/− DCs/RA-DCs were co-cultured with CFSE labeled OT-II T cells (1:10, DC/RA-DC:T) in the presence of WT DCs (1:20, DC:T) and OVA protein. Cell division was determined by FACs. Data show a representative histogram and the mean percentages of proliferating CD4+ T cells + SE of four experiments. (C) Nitrite levels were measured in the supernatants of these co-cultures at 72 h by Griess assay. Data represented as the mean percentages of dividing CD4+ T cells + SE of three independent experiments. (D) Cell lysates from WT and IFN-γR1−/− DCs/RA-DCs were analyzed for Arg-1 expression by Western blotting. GAPDH was used as a loading control. (E) L-arginine levels in WT or IFN-γR1−/− RA-DC-T cell co-culture (as set up in Figure 7B) supernatants were analyzed by HPLC. Control indicates complete RPMI medium. Data show mean + SE of three experiments. (F) Cell lysates from BM cells cultured in the presence of GM-CSF and/or IL-4 and/or ATRA, with or without IFN-γ stimulation for 24 h. DCs/RA-DCs were analyzed for Arg-1 expression by Western blotting. GAPDH was used as a loading control. Data representative of three experiments. *p < 0.05
FIGURE 8
FIGURE 8
RA-DCs mediate suppression through Arg-1 and iNOS mediated mechanisms in vivo. (A) 5×10⁶ CFSE labeled OT-II T cells were injected i.v. into B6 recipient mice who were then subcutaneously injected in the footpads with DCs or RA-DCs pulsed with OVA protein. Unpulsed DCs were injected in control mice. Transferred OT-II T cells were recovered from the primary draining popliteal lymph nodes 3 days later and proliferation of OT-II T cells was assessed by CD4 staining of CFSE+ T cells. (B) WT or GCN2−/− OT-II T cells were purified and labeled with CFSE (as previously described) and injected i.v. into B6 recipients. WT DCs or RADCs were pulsed with OVA protein and subcutaneously injected into the footpads of recipients. OT-II T cells were recovered after 3 days and proliferation was determined by CFSE dilution assay. (C) B6 recipients were injected i.v. with WT OT-II T cells. Recipients were then immunized with OVA protein pulsed WT or iNOS−/− DCs or RA-DCs at the footpads. After 3 days, OT-II T cells were recovered and assessed for proliferation. In all experiments, cells were gated on live cells expressing CFSE and CD4. Data for 8A-C are presented in the form of a representative histogram and display the mean percentages of dividing CD4+ T cells + SE of four independent experiments. *p < 0.05

References

    1. Yu M-C, Chen C-H, Liang X, Wang L, Gandhi CR, Fung JJ, Lu L, Qian S. Inhibition of T-cell responses by hepatic stellate cells via B7-H1-mediated T-cell apoptosis in mice. Hepatology. 2004;40:1312–1321. - PubMed
    1. Chen C-H, Kuo L-M, Chang Y, Wu W, Goldbach C, Ross MA, Stolz DB, Chen L, Fung JJ, Lu L, Qian S. In vivo immune modulatory activity of hepatic stellate cells in mice. Hepatology. 2006;44:1171–1181. - PubMed
    1. Chou H-S, Hsieh C-C, Yang H-R, Wang L, Arakawa Y, Brown K, Wu Q, Lin F, Peters M, Fung JJ, Lu L, Qian S. Hepatic Stellate Cells Regulate Immune Response via Induction of Myeloid Suppressor Cells. Hepatology. 2011;53:1007–1019. - PMC - PubMed
    1. Blomhoff R, Wake K. Perisinusoidal stellate cells of the liver: important roles in retinol metabolism and fibrosis. FASEB J. 1991;5:271–277. - PubMed
    1. Mic FA, Molotkov A, Benbrook DM, Duester G. Retinoid activation of retinoic acid receptor but not retinoid X receptor is sufficient to rescue lethal defect in retinoic acid synthesis. Proc. Natl. Acad. Sci. U.S.A. 2003;100:7135–7140. - PMC - PubMed

Publication types

MeSH terms