. 2014 Apr 30;34(18):6128-39.
doi: 10.1523/JNEUROSCI.4941-13.2014.

Kainate receptors mediate signaling in both transient and sustained OFF bipolar cell pathways in mouse retina

Affiliations

Kainate receptors mediate signaling in both transient and sustained OFF bipolar cell pathways in mouse retina

Bart G Borghuis et al. J Neurosci. .

Abstract

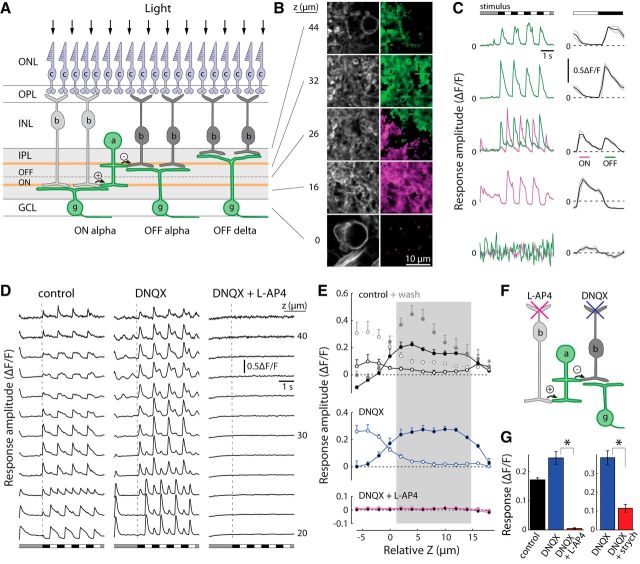
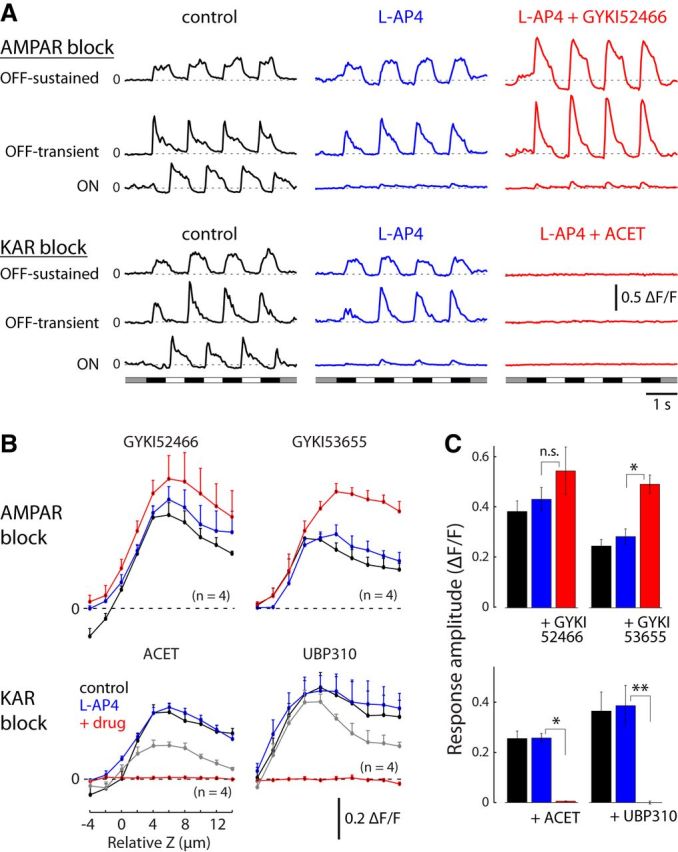
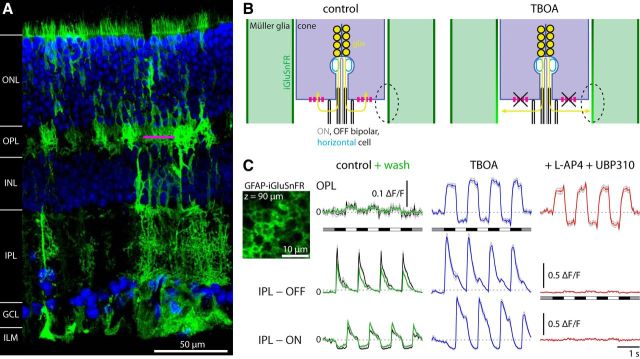
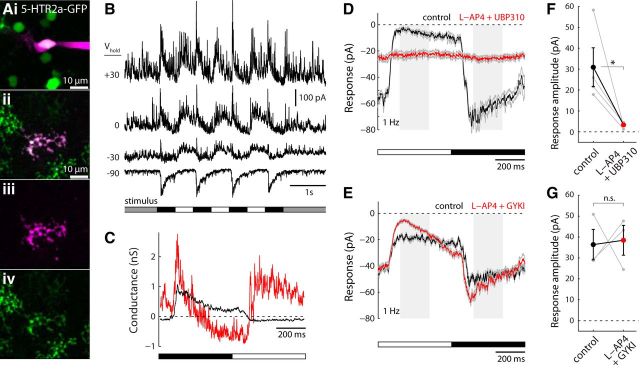
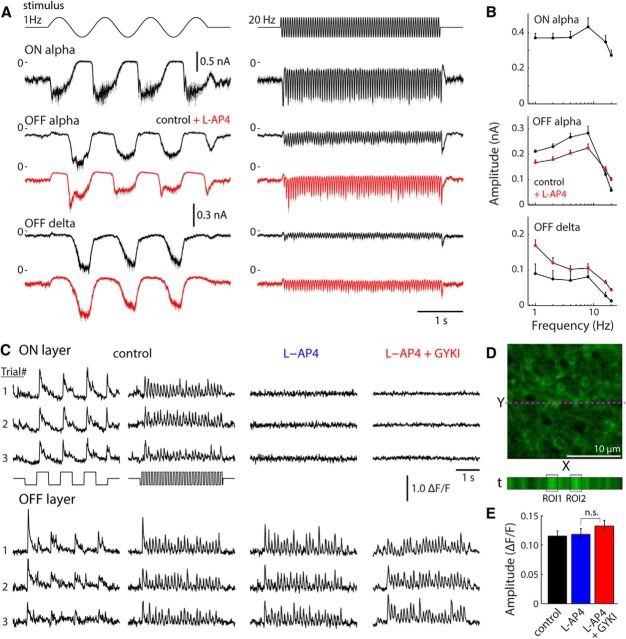
A fundamental question in sensory neuroscience is how parallel processing is implemented at the level of molecular and circuit mechanisms. In the retina, it has been proposed that distinct OFF cone bipolar cell types generate fast/transient and slow/sustained pathways by the differential expression of AMPA- and kainate-type glutamate receptors, respectively. However, the functional significance of these receptors in the intact circuit during light stimulation remains unclear. Here, we measured glutamate release from mouse bipolar cells by two-photon imaging of a glutamate sensor (iGluSnFR) expressed on postsynaptic amacrine and ganglion cell dendrites. In both transient and sustained OFF layers, cone-driven glutamate release from bipolar cells was blocked by antagonists to kainate receptors but not AMPA receptors. Electrophysiological recordings from bipolar and ganglion cells confirmed the essential role of kainate receptors for signaling in both transient and sustained OFF pathways. Kainate receptors mediated responses to contrast modulation up to 20 Hz. Light-evoked responses in all mouse OFF bipolar pathways depend on kainate, not AMPA, receptors.

Keywords: OFF bipolar cell; glutamate sensor; kainate receptor; mouse; retinal circuitry; two-photon imaging.


Conflict of interest statement

Conflict of interest: B.G.B. owns Borghuis Instruments, which sells the specialized syringe that was used for intravitreal virus injections in this study.

Figures

Figure 1.
Figure 1.
ON-pathway crossover inhibition drives glutamate release in all OFF-levels of the IPL. A, UV light stimuli were projected onto the photoreceptors (cones, c; rods were saturated and are omitted from schematic for clarity). Light-evoked glutamate release from ON-type (light gray) and OFF-type (dark gray) bipolar cells (b) was measured with two-photon fluorescence imaging of iGluSnFR (green), expressed on the dendritic arbors of ganglion (g) and amacrine cells (a). A crossover inhibition pathway is shown: ON bipolar cell excites (+) amacrine cell, which inhibits (−) OFF bipolar cell terminals. Orange lines illustrate the stratification depths of ON- and OFF-type starburst amacrine cells, a commonly used anatomical marker in the retina. Dashed line indicates the ON/OFF boundary (see B) B, Left, Fluorescence image of labeled processes at the indicated focal planes. Right, Light-evoked responses were ON-type (increase to light, magenta) from the ganglion cell layer to the central IPL and OFF-type (decrease to light, green) from the central IPL to the inner nuclear layer, with mixed, spatially nonoverlapping regions at the ON/OFF junction (z = 26 μm). C, Left, Fluorescence responses of ON and OFF regions shown in B. Right, Average response of all pixels with significant modulation (see Materials and Methods). Responses to three periods were averaged (shaded area: mean ± SEM). ON- and OFF-response at each level were defined as the amplitude of the fluorescence signal in 200 ms windows (indicated with magenta and green lines) relative to baseline. D, Average fluorescence response at 12 levels of the IPL, centered on the OFF layers (control; left). All OFF-type responses persisted in the presence of the iGluR antagonist DNQX (100 μm; center). Additional block of the ON-pathway (L-AP4, 20 μm) eliminated all responses (data from a single retinal location). E, Average ON (open symbols) and OFF (closed symbols) response amplitudes in control, DNQX and DNQX + L-AP4 (n = 6 locations, three retinas). Response after wash is shown with control (top). The ON/OFF junction was located ∼25–30 μm distal to the ganglion cell layer (see Materials and Methods). In this panel and in subsequent figures z-positions are expressed relative to the ON/OFF junction (relative Z). F, Schematic of the drug perturbations. L-AP4 blocks synaptic input to ON bipolar cells (light gray); DNQX blocks synaptic input to OFF bipolar cells (dark gray). DNQX additionally blocks glutamatergic input to amacrine and ganglion cells (not illustrated). G, Bar graph of response amplitudes averaged across the principal OFF levels (14 μm Z-range, indicated by shaded region in E) in the presence of DNQX + L-AP4 (left; n = 6 locations, three retinas) and DNQX + 1 μm strychnine (right; n = 4 locations, two retinas); *p < 0.01.
Figure 2.
Figure 2.
Kainate receptor antagonists block synaptic release from all OFF-type bipolar cells. A, Fluorescence responses in an ON (relative Z = −4), transient OFF (relative Z = 6) and sustained OFF layer (relative Z = 12) of the IPL. B, Fluorescence responses at OFF-levels of the IPL in the presence of iGluR blockers: AMPAR antagonists GYKI52466 (100 μm) and GYKI53655 (100 μm); KAR antagonists ACET (1 μm) and UBP310 (50 μm). Gray curves (bottom) show the response after 15 min wash to control condition. Z is defined relative to the ON/OFF boundary. C, Bar graph of response amplitudes for each condition shown in B. Responses were averaged across eight z-planes, spanning 14 μm (Fig. 1E). n.s., Not significant; *p < 0.005; **p = 0.020.
Figure 3.
Figure 3.
Kainate receptor block eliminates excitatory currents in OFF-type ganglion cells. A, Excitatory currents in an ON-α cell (black) persisted in the presence of NMDA and ACh antagonists (D-AP5, 100 μm + hexamethonium, 100 μm, blue) and after additional block of KARs (top; ACET 1 μm, red) but were blocked by antagonists of AMPARs (bottom; GYKI53655, 50 μm, red; GYKI53655, 100 μm, cyan dashed). Gray curve shows the response after 15 min wash to control condition. B, Effect of KAR and AMPAR block in three ON-α cells (gray, individual cells, black mean ± SEM; amplitude was calculated over 200 ms window, 100 ms following onset of the preferred stimulus phase); *p < 0.01. C, Excitatory currents in OFF-α- and OFF-δ-type ganglion cells under control conditions (black) and in the presence of L-AP4 (blue). Responses in the presence of L-AP4 were eliminated by additional block of KARs (red; UBP310, 50 μm or ACET, 1 μm). Gray curves as in A. D, Effect of KAR block in OFF-α and -δ cells (individual cells: dashed/green = dorsal retina; solid/magenta = ventral retina; black, mean ± SEM). Amplitudes were calculated as the mean leak-subtracted current 100–300 ms after onset of the preferred stimulus phase; *p < 0.01. E, Effect of ACET and D-AP5 on excitatory currents in an OFF-α and an OFF-δ cell. Green indicates response after wash to control condition after additional block with L-AP4. Gray, blue, and magenta show responses under three different stimulus conditions, standard: typical conditions used throughout; dim light: 2 log-unit lower-mean light level; dark: photopic intensity flash against dark background (see Materials and Methods). Inset (bottom, right) shows magnification of the trace above. F, Response amplitudes under control conditions and in the presence of ACET and D-AP5 (as in E) for all recorded cells (OFF-α: n = 4; OFF-δ: n = 3).
Figure 4.
Figure 4.
Synaptic release from photoreceptors persists in the presence of L-AP4 and KAR block. A, Confocal image of a vertical section of the retina 16 d after transduction with AAV2/1-GFAP-iGluSnFR (8 × 10¹² IU/μl). Blue, Nuclear stain (DAPI); green, iGluSnFR (native fluorescence); ONL, outer nuclear layer; GCL, ganglion cell layer; ILM, inner limiting membrane. Magenta line shows the approximate location of line scans shown in C, recorded with two-photon imaging in whole-mount retinas with iGluSnFR expression similar to the retina shown here. B, Conceptual model of iGluSnFR activation in the OPL. Under control conditions (left) glutamate is taken up by transporters expressed on presynaptic and postsynaptic (data not shown) neurons; glutamate does not reach the Müller cell processes at sufficient concentrations to evoke a detectable iGluSnFR response. With glutamate uptake blocked (right), the glutamate concentration near the site of synaptic release increases sufficiently to reach Müller cell processes and cause detectible activation of iGluSnFR. Thus, by impairing glutamate uptake, light-evoked glutamate release from photoreceptors can be visualized. C, iGluSnFR fluorescence responses in Müller glia. Under control conditions (left) iGluSnFR responses were only detected in the IPL. Top trace (OPL, two-photon fluorescence image shown at left) shows only moderate modulation caused by low-level bleed-through of stimulus light into the fluorescence detectors. The glutamate transporter blocker TBOA (20 μm) increased the response amplitude and duration in the IPL and revealed light-evoked responses in the OPL (right). Because photoreceptors release at light offset, the evoked response and stimulus artifact apparent during control conditions were of opposite sign. The pharmacological condition that eliminated glutamate release from all bipolar cells (L-AP4 + UBP310; Fig. 2A–C, 3C–D) blocked light-evoked responses in ON and OFF IPL, but left photoreceptor responses intact (curves show data from a single recording; the same result was observed in 3/3 recordings).
Figure 5.
Figure 5.
Kainate receptor block eliminates excitatory currents in type-4 OFF bipolar cells. Whole-cell patch-clamp recordings from GFP-expressing type-4 bipolar cells in the whole-mount retina of 5-HTR2a-GFP transgenic mice. Ai, Two-photon fluorescence images of GFP-expressing bipolar cells (green) including the recorded cell. Sulforhodamine 101 in the intracellular solution shows the pipette and recorded cell in magenta; AiiAiv, Two-photon image at the level of the type-4 bipolar axon terminal, showing overlay (Aii) and separate views of red (Aiii) and green (Aiv) channels. B, Light-evoked current responses at four holding potentials. Type-4 bipolar cells receive inhibition at light OFF and at light ON; the latter is consistent with crossover inhibition from the ON pathway (Fig. 1). C, Excitatory (black) and inhibitory (red) conductance of the type-4 bipolar cell shown in A. Excitatory (inhibitory) conductance was the current recorded at ECl (Ecation) divided by the driving force, −67 mV (+67 mV). D, Excitatory currents evoked by a 1 Hz, temporal square wave stimulus. Bath application of L-AP4 and the KAR antagonist UBP310 (50 μm) blocked the response. E, Light-evoked excitatory currents persisted in the presence of L-AP4 and the AMPAR antagonist GYKI53655 (100 μm). F, G, Response amplitudes in control and drug conditions for all recorded type-4 cells (KAR block, n = 4; AMPAR block, n = 3). Gray lines show individual cells, black lines show mean ± SEM; *p < 0.05.
Figure 6.
Figure 6.
Kainate receptors on OFF bipolar cell dendrites support fast temporal processing. A, Whole-cell patch-clamp recordings of excitatory currents in ON-α, OFF-α, and OFF-δ ganglion cells stimulated with sinusoidal light modulation under control conditions (black) and in L-AP4 (red). Blocking the ON pathway did not suppress responses to 20 Hz modulation. B, Temporal tuning curves of OFF-α, OFF-δ, and ON-α cells (black: control; red: L-AP4). C, iGluSnFR fluorescence responses to 1.0 and 7.5 Hz square-wave stimulation, measured with 2.0 kHz line scans at the level of ON and OFF bipolar cell output (z = 16 and 32 μm, respectively). Trials 1–3 show the response to three consecutive stimulus presentations for each condition; 1.0 Hz stimulus shown for control condition only. L-AP4 blocked release in the ON layers. In the OFF layer, 7.5 Hz responses persisted in the presence of L-AP4 and the AMPAR blocker GYKI53655 (100 μm). D, Fluorescence image at the level of the OFF IPL (z = 32 μm) with line scan location (magenta); X-time (t) plot with example ROIs indicated is shown below image. E, Average amplitude (± SEM) during 7.5 Hz modulation across conditions (n = 60 ROIs; see Materials and Methods for definition). n.s., p = 0.32.

References

    1. Applebury ML, Antoch MP, Baxter LC, Chun LL, Falk JD, Farhangfar F, Kage K, Krzystolik MG, Lyass LA, Robbins JT. The murine cone photoreceptor: a single cone type expresses both S and M opsins with retinal spatial patterning. Neuron. 2000;27:513–523. - PubMed
    1. Arman AC, Sampath AP. Dark-adapted response threshold of OFF ganglion cells is not set by OFF bipolar cells in the mouse retina. J Neurophysiol. 2012;107:2649–2659. doi: 10.1152/jn.01202.2011. - DOI - PMC - PubMed
    1. Ashmore JF, Copenhagen DR. An analysis of transmission from cones to hyperpolarizing bipolar cells in the retina of the turtle. J Physiol. 1983;340:569–597. - PMC - PubMed
    1. Awatramani GB, Slaughter MM. Intensity-dependent, rapid activation of presynaptic metabotropic glutamate receptors at a central synapse. J Neurosci. 2001;21:741–749. - PMC - PubMed
    1. Baden T, Berens P, Bethge M, Euler T. Spikes in mammalian bipolar cells support temporal layering of the inner retina. Curr Biol. 2013;23:48–52. doi: 10.1016/j.cub.2012.11.006. - DOI - PubMed

Publication types

MeSH terms