. 2014 Apr 30;34(18):6164-76.
doi: 10.1523/JNEUROSCI.3458-13.2014.

Hyaluronan deficiency due to Has3 knock-out causes altered neuronal activity and seizures via reduction in brain extracellular space

Affiliations

Hyaluronan deficiency due to Has3 knock-out causes altered neuronal activity and seizures via reduction in brain extracellular space

Amaia M Arranz et al. J Neurosci. .

Abstract

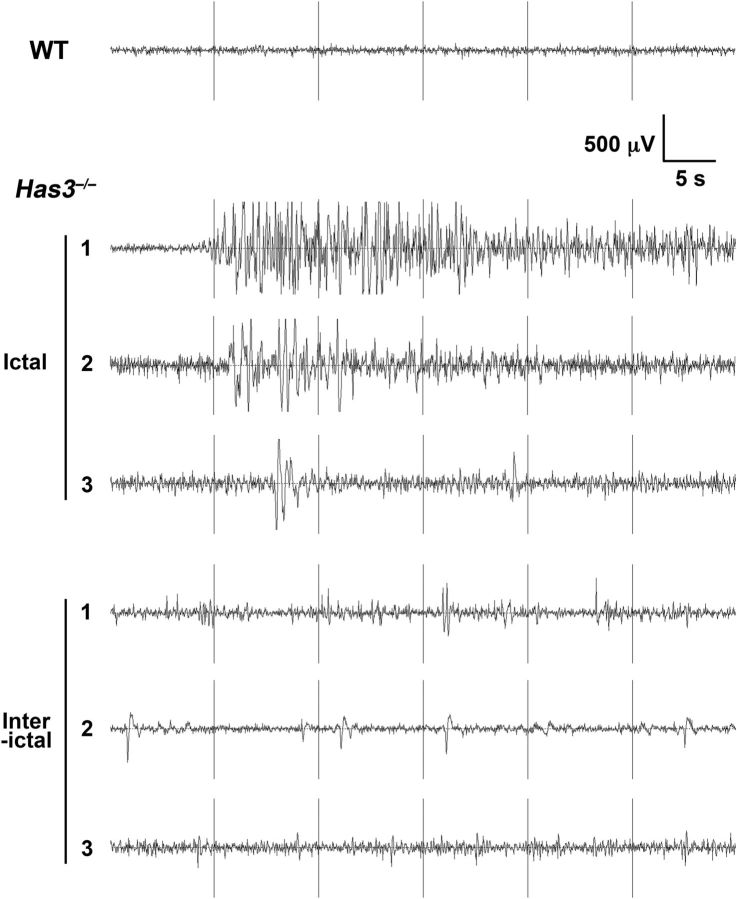
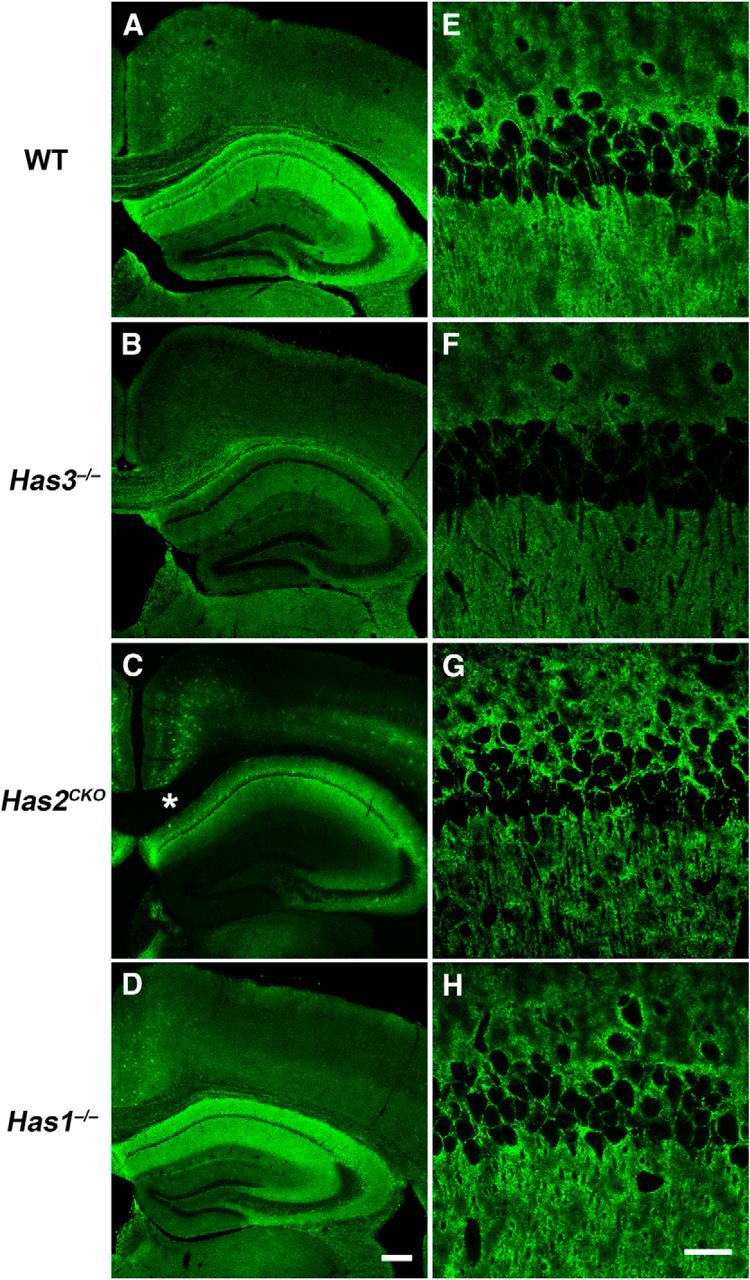
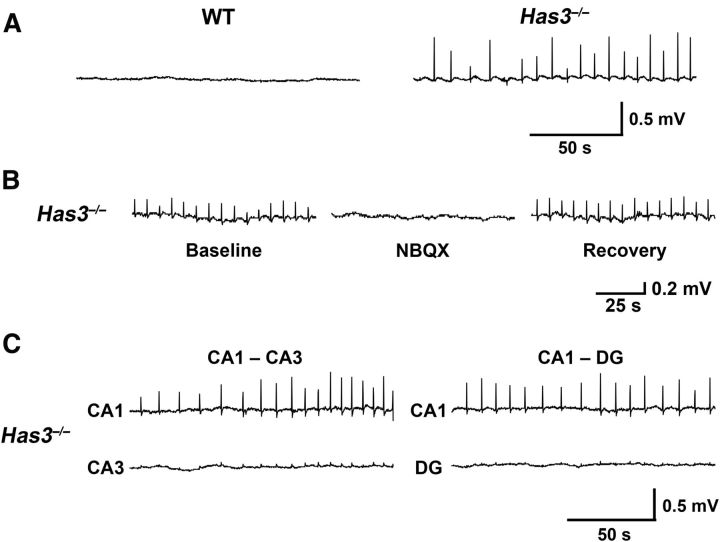
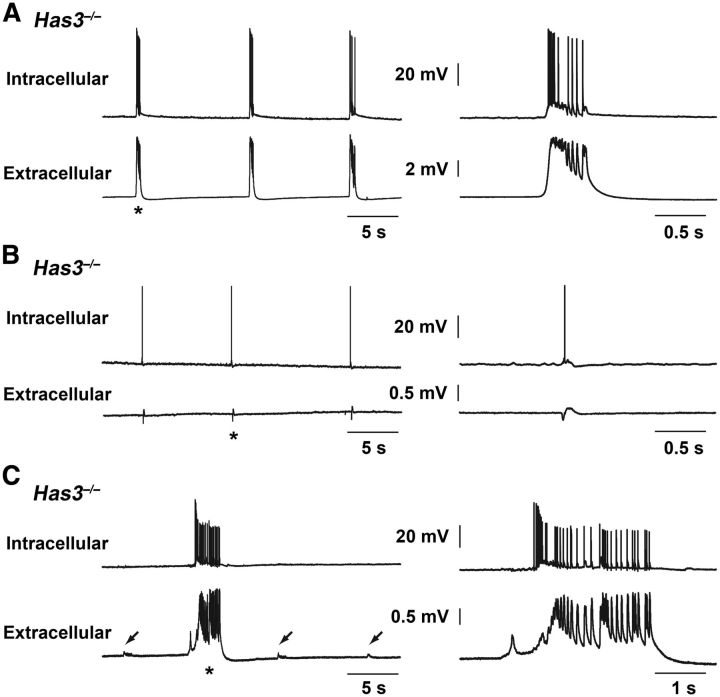
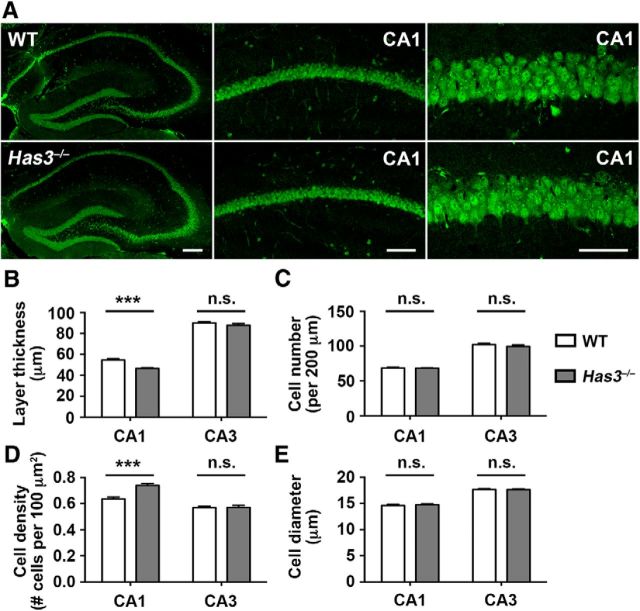
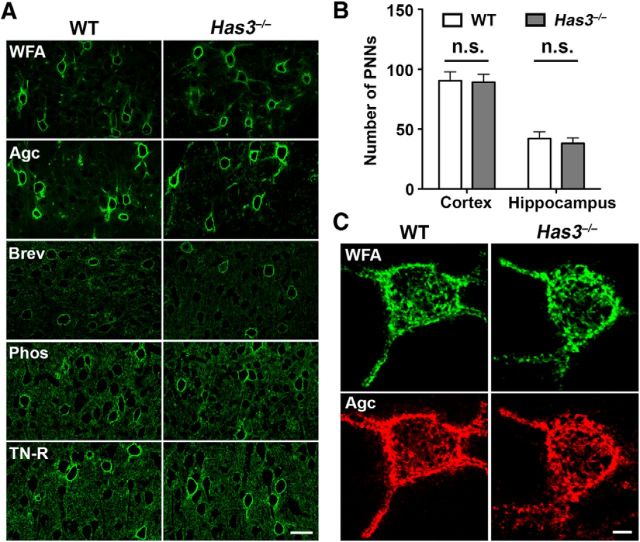
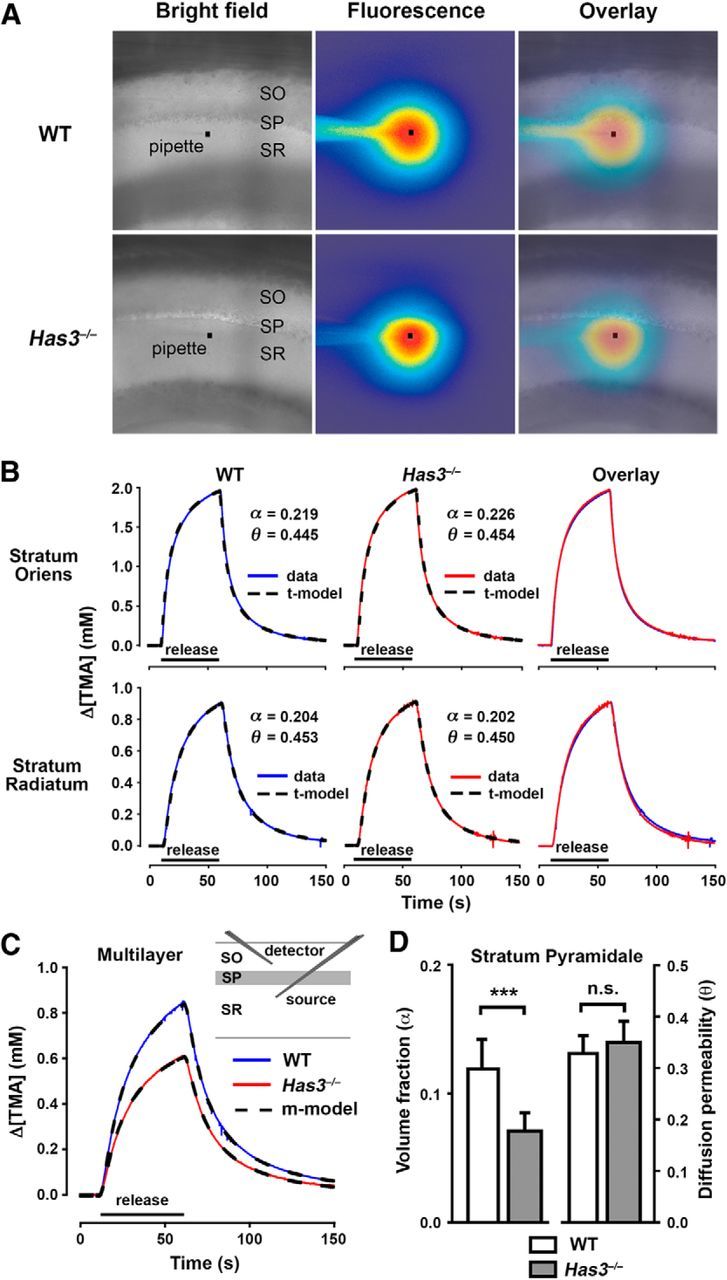
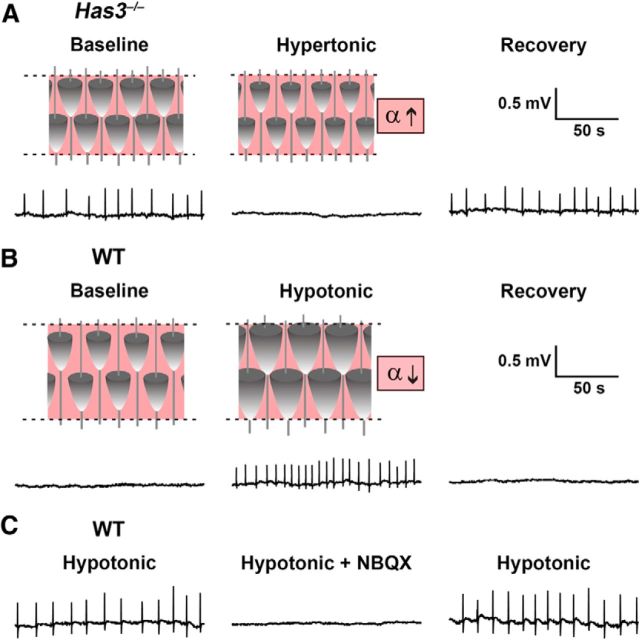
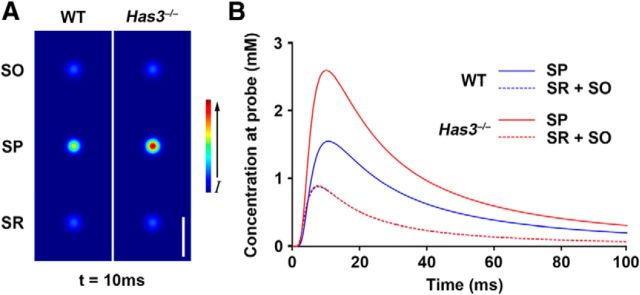
Hyaluronan (HA), a large anionic polysaccharide (glycosaminoglycan), is a major constituent of the extracellular matrix of the adult brain. To address its function, we examined the neurophysiology of knock-out mice deficient in hyaluronan synthase (Has) genes. Here we report that these Has mutant mice are prone to epileptic seizures, and that in Has3(-/-) mice, this phenotype is likely derived from a reduction in the size of the brain extracellular space (ECS). Among the three Has knock-out models, namely Has3(-/-), Has1(-/-), and Has2(CKO), the seizures were most prevalent in Has3(-/-) mice, which also showed the greatest HA reduction in the hippocampus. Electrophysiology in Has3(-/-) brain slices demonstrated spontaneous epileptiform activity in CA1 pyramidal neurons, while histological analysis revealed an increase in cell packing in the CA1 stratum pyramidale. Imaging of the diffusion of a fluorescent marker revealed that the transit of molecules through the ECS of this layer was reduced. Quantitative analysis of ECS by the real-time iontophoretic method demonstrated that ECS volume was selectively reduced in the stratum pyramidale by ∼ 40% in Has3(-/-) mice. Finally, osmotic manipulation experiments in brain slices from Has3(-/-) and wild-type mice provided evidence for a causal link between ECS volume and epileptiform activity. Our results provide the first direct evidence for the physiological role of HA in the regulation of ECS volume, and suggest that HA-based preservation of ECS volume may offer a novel avenue for development of antiepileptogenic treatments.


Figures

Figure 1.
Figure 1.
Spontaneous epileptic seizures in Has mutant mice. Representative tracings of electrographic seizures (Ictal) and of interictal abnormal activity (Interictal) observed in three independent Has3−/− mice are shown. A tracing of baseline EEG activity in a WT mouse is shown at the top. Spike amplitude (in microvolts on y-axis) is plotted as a function of recorded time course (in seconds on x-axis).
Figure 2.
Figure 2.
Spatial patterns of HA reduction in three Has mutant mouse models. Tissue staining of HA with biotinylated hyaluronan-binding protein (Laurent et al., 1991) was performed in the forebrain sections of WT (A, E), Has3−/− (B, F), Has2CKO (C, G), and Has1−/− (D, H) mice. Note that in WT mice, HA is strongly expressed in the hippocampus (A). In Has3−/− mice, hippocampal HA staining is markedly reduced (B). On the other hand, HA staining in the hippocampus is largely preserved in Has2CKO mice (C). Instead, reduction in HA is prominent in the superficial layers of the cortex and in fiber tracts in Has2CKO mice (e.g., the corpus callosum and the cingulum bundle; C, asterisk). The HA staining pattern in Has1−/− mice is essentially indistinguishable from that of WT mice (D). Scale bar, 200 μm. E–H, High-magnification images of the CA1 region. Note that not only is the level of HA staining greatly reduced in Has3−/− mice, but intercellular HA staining between neurons in the stratum pyramidale is essentially lost in Has3−/− mice (F). Scale bar, 30 μm.
Figure 3.
Figure 3.
Spontaneous epileptiform activity in the CA1 region of Has3−/− hippocampus. A, Extracellular field potential recordings in the stratum pyramidale of CA1 hippocampus in brain slices from WT and Has3−/− mice. No activity was found in the WT slices, whereas rhythmic spontaneous field potentials were observed in the Has3−/− slices. B, These spontaneous field potentials in the Has3−/− slices were blocked by the AMPA/kainate glutamate receptor antagonist NBQX (10 μm), and they were restored in NBQX-free ACSF. C, Extracellular recordings were made in the stratum pyramidale of the CA3 region (CA3; n = 5) and the granule cell layer of the dentate gyrus (DG; n = 5) of the hippocampal formation in Has3−/− brain slices. We found no or very small field potentials in CA3 and DG. In two of the slices, dual extracellular recordings were performed with one electrode in the stratum pyramidale of CA1 hippocampus and the other in either the stratum pyramidale of CA3 hippocampus (left) or the granule cell layer of the DG (right). Dual extracellular recordings showed rhythmic spontaneous field potentials in CA1 and much smaller field potentials, occurring synchronously with the CA1 field potentials, in CA3 and DG.
Figure 4.
Figure 4.
Simultaneous intracellular and field potential recordings in the CA1 region of the Has3−/− hippocampus. AC, Tracings illustrate the range of excitatory activity seen in CA1 stratum pyramidale neurons coincident with the spontaneous field potentials in brain slices from Has3−/− mice. Top tracing is intracellular recording from the Has3−/− CA1 stratum pyramidale, and bottom tracing is simultaneous field potential recording with extracellular electrode placed at the border of CA1 stratum radiatum and stratum lacunosum-moleculare. Asterisk indicates the event that is expanded in the right column. A, This neuron showed interictal-like epileptiform events coincident with the rhythmic field potentials. Input resistance 23 MΩ, resting potential −70 mV. B, This neuron showed a small depolarization and single action potential coincident with each of the rhythmic field potentials. Input resistance 23 MΩ, resting potential −65 mV. C, This neuron showed only a tiny depolarization or no apparent membrane potential change coincident with each of the small rhythmic field potentials (arrows). However, ictal-like bursting occurred in the cell coincident with infrequent, larger, ictal-like field potentials. Right side of the figure shows that the ictal-like field potential began before this cell began to fire, but that the later individual peaks in the field potential correspond to depolarizations and action potentials in the cell. Input resistance 16 MΩ, resting potential −55 mV. Results presented in A–C are from three different slices.
Figure 5.
Figure 5.
Increased cell packing in the CA1 stratum pyramidale of Has3−/− mice. A, NeuN immunostaining of the hippocampus of Has3−/− mice and WT littermates. Low-magnification views of hippocampus (left). Scale bar, 200 μm. CA1 stratum pyramidale (middle). Scale bar, 100 μm. High-magnification views of the CA1 (right). Scale bar, 50 μm. BE, Morphometric analyses of the stratum pyramidale of Has3−/− mice and WT littermates. The thickness of the stratum pyramidale (B), the number of neurons contained within the layer (per 200 μm long segment; C), the density of neurons contained within the layer (per 100 μm2; D), and the size of soma (longest diameter) of pyramidal neurons (E) were determined in NeuN-stained sections; n = 24 per genotype, ***p < 0.001; n.s., not significant (Student's t test).
Figure 6.
Figure 6.
PNNs are normally formed in the Has3−/− brain. A, Cortical sections of WT and Has3−/− mice were stained with FITC-conjugated WFA (WFA), and antibodies to aggrecan (Agc), brevican (Brev), phosphacan (Phos), or tenascin-R (TN-R). Scale bar, 30 μm. B, The number of neurons bearing PNNs was determined in the cortex (Cortex) and the hippocampus (Hippocampus), as described in Materials and Methods. There are no statistical differences in the number of PNNs between WT and Has3−/− mice (Student's t test; n = 5 per genotype). C, Representative confocal images of PNN-bearing neurons double-labeled with FITC-conjugated WFA (WFA) and anti-aggrecan antibody (Agc). Note that staining patterns of PNNs are indistinguishable between WT and Has3−/− neurons. Scale bar, 5 μm.
Figure 7.
Figure 7.
ECS is reduced in the CA1 stratum pyramidale in Has3−/− mice. A, Transit of extracellular marker molecules through the CA1 stratum pyramidale. Fluorescently labeled extracellular marker dex3 was released by a short puff from a glass micropipette (black square denotes tip) placed in the stratum radiatum close to the border with the stratum pyramidale. Overlay of bright field and fluorescence images at 80 s after release. Distribution of dex3 molecules showed an asymmetry, which was much more prominent in the Has3−/− mice than in the WT mice. The asymmetry arose at the border between the stratum radiatum and the stratum pyramidale. SO, stratum oriens; SP, stratum pyramidale; SR, stratum radiatum. B–D, Quantitative analysis of ECS in the CA1 hippocampus by the RTI method. B, Representative examples of diffusion records from the stratum oriens and the stratum radiatum of WT and Has3−/− mice. TMA curves (data) fitted with traditional model curves (t-model) are shown, together with corresponding values of α and θ. For stratum oriens, κ was 0.0050 s−1 in WT and 0.0059 s−1 in Has3−/−. For stratum radiatum, κ was 0.0092 s−1 in WT and 0.0014 s−1 in Has3−/−. Microelectrode spacing was 80 and 124 μm for the stratum oriens records and the stratum radiatum records, respectively, and nt was 0.31 for both records taken in the two locations. C, Representative examples of multilayer diffusion curves in WT and Has3−/− mice. TMA curves (WT, Has3−/−) fitted with multilayer model curves (m-model) are shown, and a diagram indicates the placement of TMA-selective (detector) and iontophoretic (source) microelectrodes. Multilayer analysis was used to obtain ECS parameters for the CA1 stratum pyramidale: in WT, α = 0.129, θ = 0.308, and κ = 0.0039 s−1; in Has3−/−, α = 0.073, θ = 0.297, and κ = 0.0070 s−1. Microelectrode spacing was 120 μm and nt was 0.33 for both records taken in the two genotypes. D, Summary of ECS volume fraction and diffusion permeability values in the stratum pyramidale of WT and Has3−/− mice. ECS volume fraction was reduced by 40% in Has3−/− mice, whereas diffusion permeability was not changed (Table 3 shows statistical analysis and values of κ). Data are expressed as mean ± SD.
Figure 8.
Figure 8.
Restoration of ECS volume in Has3−/− slices blocks spontaneous epileptiform activity, whereas reduction of ECS volume in WT slices mimics Has3−/− phenotype. A, In Has3−/− slices, hypertonic conditions (400 mosmol/kg) were used to shift water from the intra- to the extracellular compartment and increase ECS volume fraction α. This manipulation reversibly blocked spontaneous epileptiform activity in the CA1 hippocampus. B, In WT slices, hypotonic conditions (200 mosmol/kg) were used to shift water from the extracellular to the intracellular compartment and decrease the ECS volume fraction. This manipulation induced spontaneous epileptiform activity in the CA1 hippocampus, which was blocked upon return to normo-osmotic ACSF. C, Epileptiform activity induced in WT brain slices was reversibly blocked by NBQX. This NBQX sensitivity was also observed in Has3−/− slices (Fig. 3B). Field potential recordings were made with electrode placed in the CA1 stratum pyramidale.
Figure 9.
Figure 9.
Simulations of diffusion in the ECS of the CA1 hippocampus in WT and Has3−/− mice. In these simulations, informed by our results on ECS parameters in individual layers, molecules were released for 1 ms from point sources in the center of each layer and allowed to diffuse. The same number of molecules was released into each layer. A, Images show concentration of diffusing molecules at 10 ms after the start of the release. Concentration is higher in the stratum pyramidale of Has3−/− mice than in that of WT mice because of the reduced ECS volume fraction. Scale bar, 25 μm. B, Concentration versus time profiles at a distance of 5 μm from each point source (measured radially from axis of symmetry). Simulations show that the concentration of a substance released into stratum pyramidale will stay higher longer in Has3−/− than in WT mice, and that a larger number of cells will simultaneously be exposed to the released substance.

References

    1. Andrew RD, Fagan M, Ballyk BA, Rosen AS. Seizure susceptibility and the osmotic state. Brain Res. 1989;498:175–180. doi: 10.1016/0006-8993(89)90417-4. - DOI - PubMed
    1. Bai KJ, Spicer AP, Mascarenhas MM, Yu L, Ochoa CD, Garg HG, Quinn DA. The role of hyaluronan synthase 3 in ventilator-induced lung injury. Am J Respir Crit Care Med. 2005;172:92–98. doi: 10.1164/rccm.200405-652OC. - DOI - PMC - PubMed
    1. Baraban SC, Southwell DG, Estrada RC, Jones DL, Sebe JY, Alfaro-Cervello C, García-Verdugo JM, Rubenstein JL, Alvarez-Buylla A. Reduction of seizures by transplantation of cortical GABAergic interneuron precursors into Kv1.1 mutant mice. Proc Natl Acad Sci U S A. 2009;106:15472–15477. doi: 10.1073/pnas.0900141106. - DOI - PMC - PubMed
    1. Bates EJ, Harper GS, Lowther DA, Preston BN. Effect of oxygen-derived reactive species on cartilage proteoglycan-hyaluronate aggregates. Biochem Int. 1984;8:629–637. - PubMed
    1. Bekku Y, Vargová L, Goto Y, Voříšek I, Dmytrenko L, Narasaki M, Ohtsuka A, Fässler R, Ninomiya Y, Syková E, Oohashi T. Bral1: its role in diffusion barrier formation and conduction velocity in the CNS. J Neurosci. 2010;30:3113–3123. doi: 10.1523/JNEUROSCI.5598-09.2010. - DOI - PMC - PubMed

Publication types

MeSH terms