. 2014 Apr 30;34(18):6245-59.
doi: 10.1523/JNEUROSCI.4330-13.2014.

Impaired path integration and grid cell spatial periodicity in mice lacking GluA1-containing AMPA receptors

Affiliations

Impaired path integration and grid cell spatial periodicity in mice lacking GluA1-containing AMPA receptors

Kevin Allen et al. J Neurosci. .

Abstract

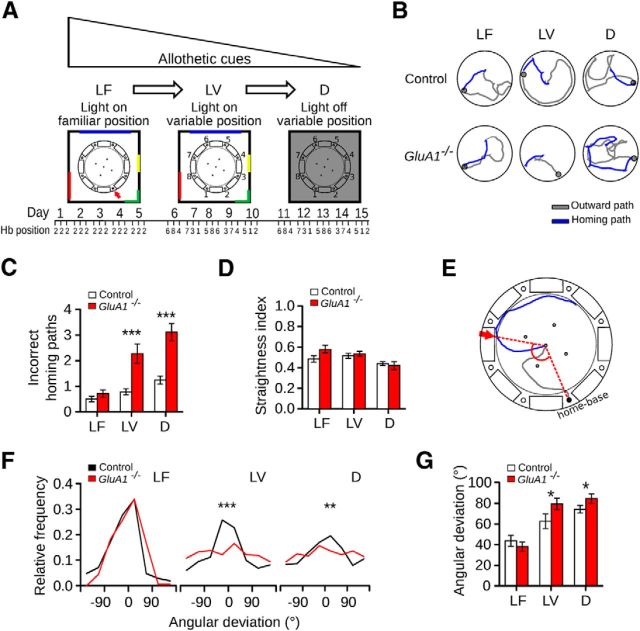
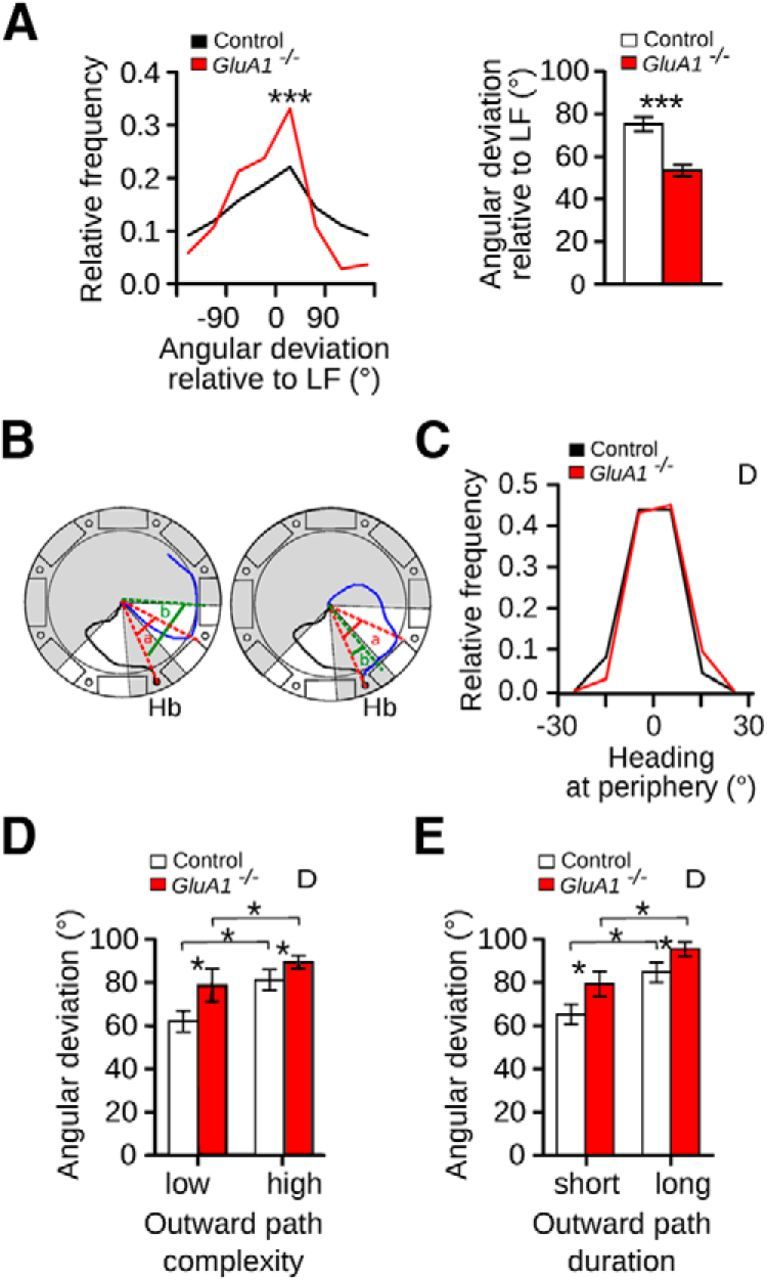
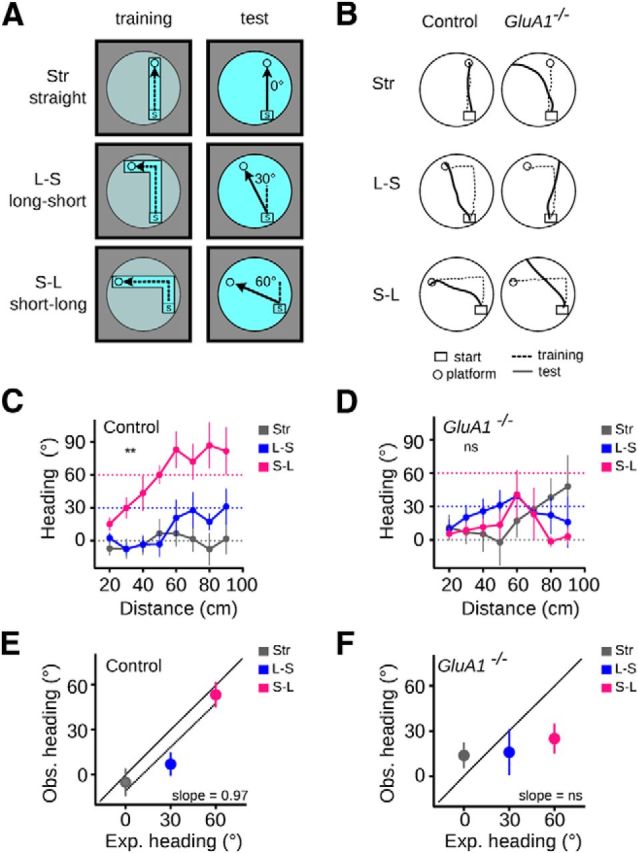
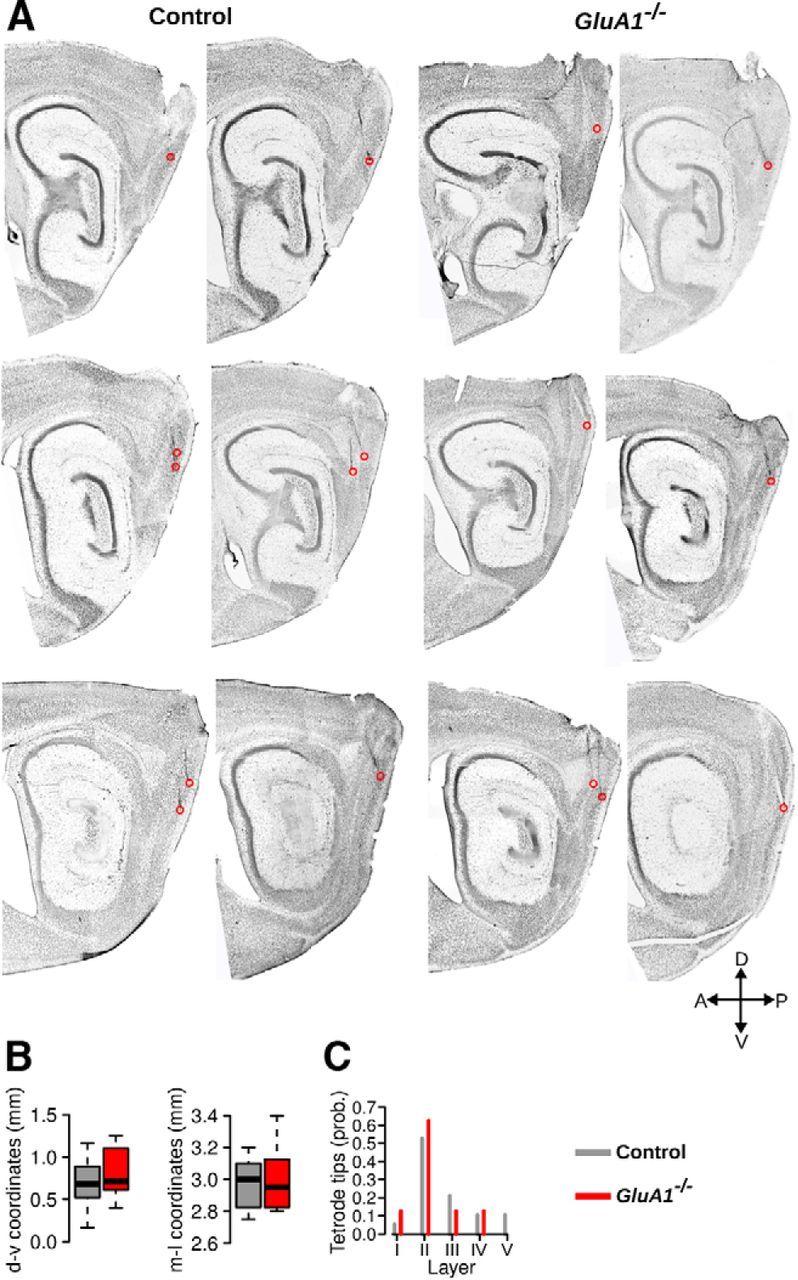
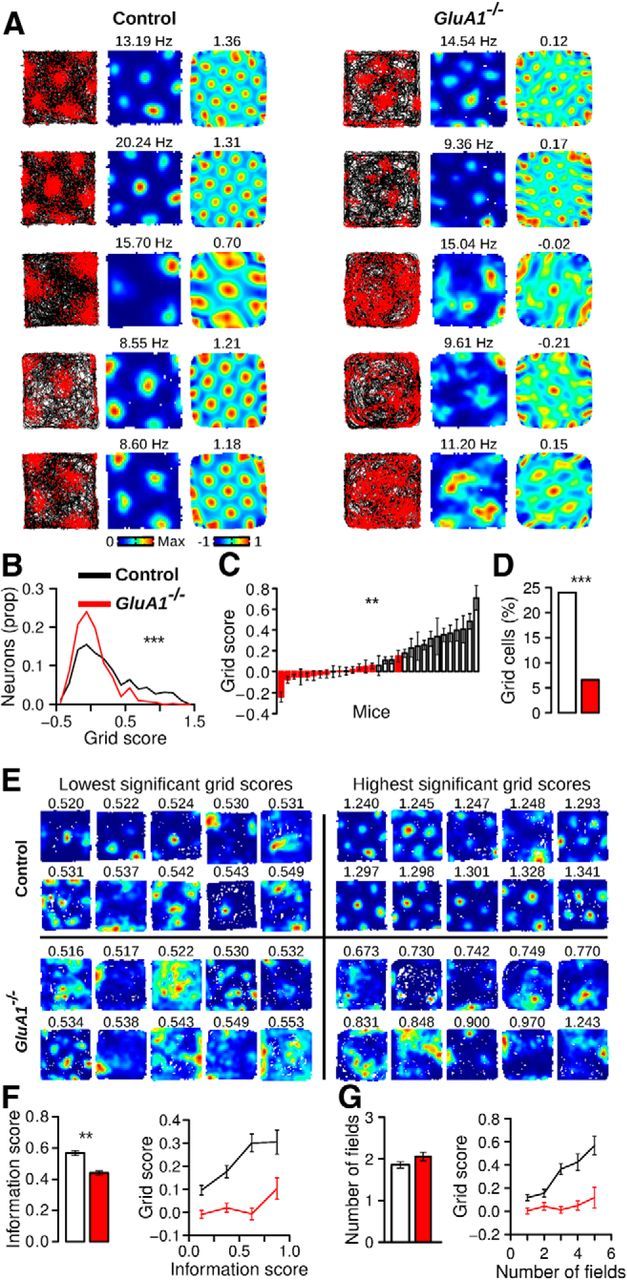
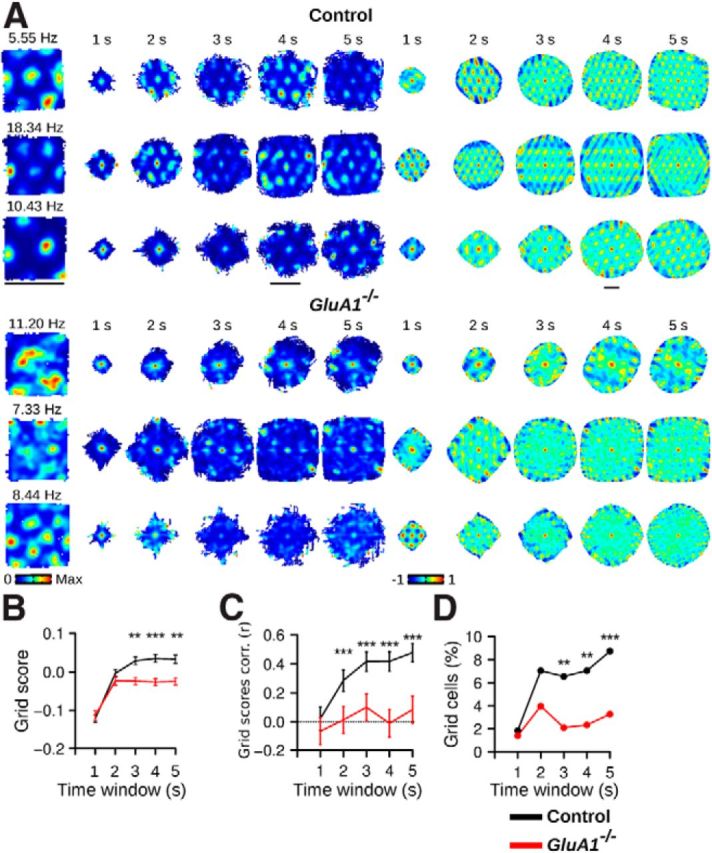
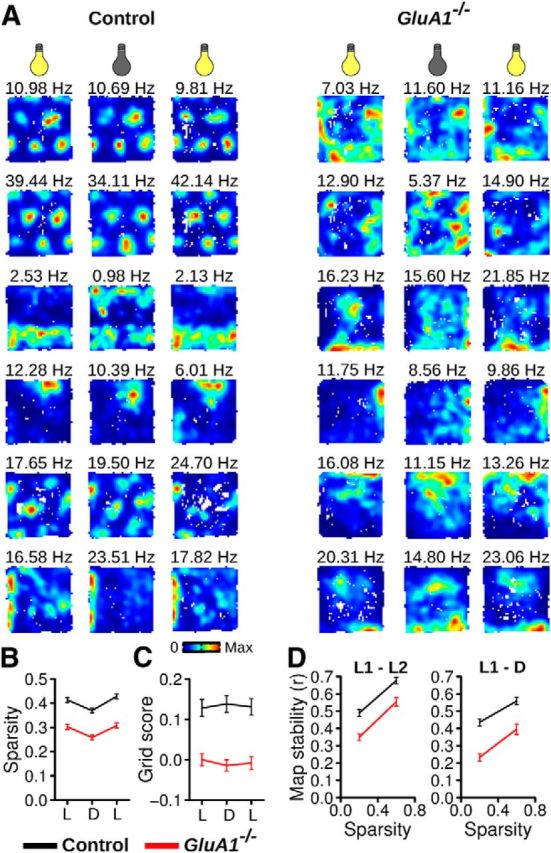
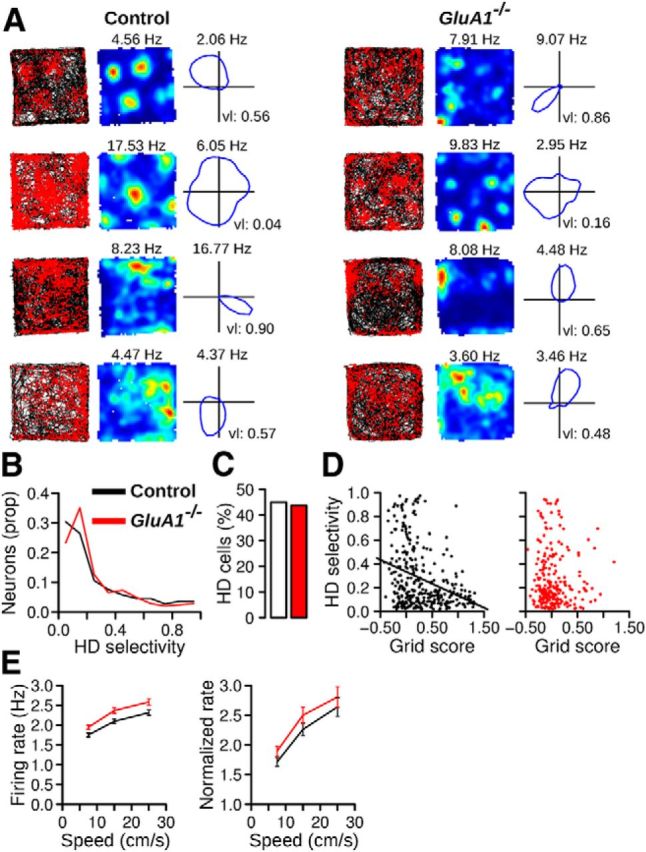
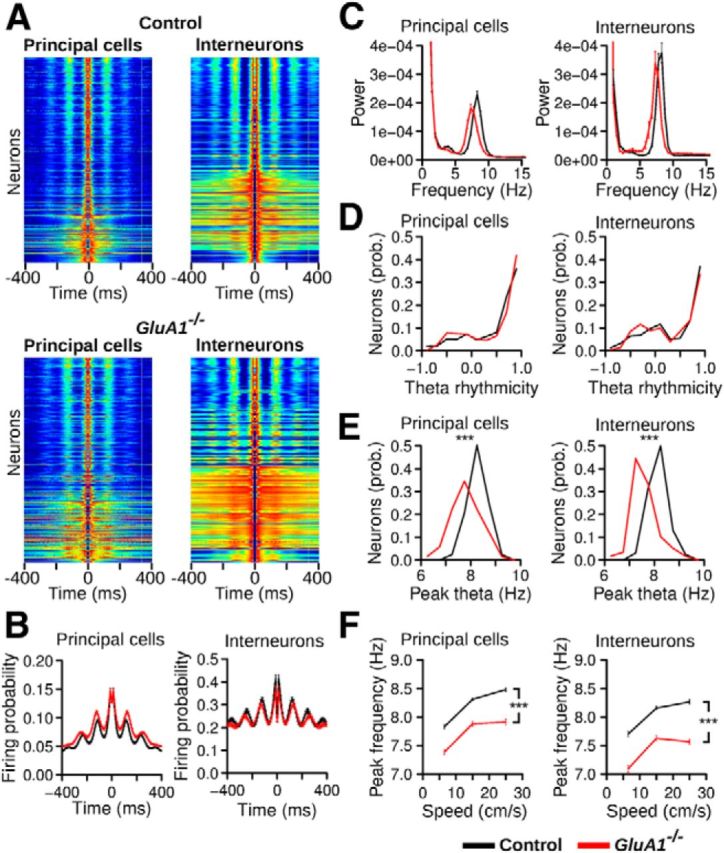
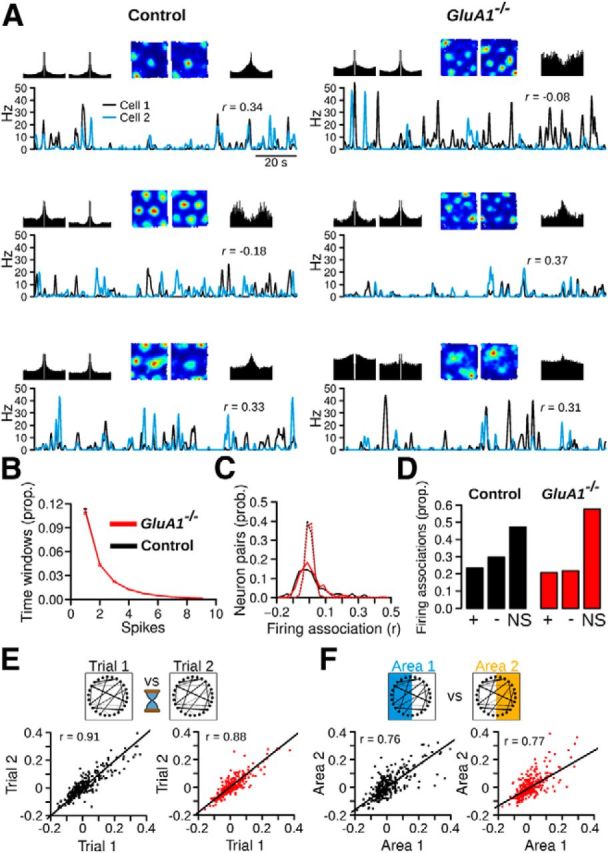
The hippocampus and the parahippocampal region have been proposed to contribute to path integration. Mice lacking GluA1-containing AMPA receptors (GluA1(-/-) mice) were previously shown to exhibit impaired hippocampal place cell selectivity. Here we investigated whether path integration performance and the activity of grid cells of the medial entorhinal cortex (MEC) are affected in these mice. We first tested GluA1(-/-) mice on a standard food-carrying homing task and found that they were impaired in processing idiothetic cues. To corroborate these findings, we developed an L-maze task that is less complex and is performed entirely in darkness, thereby reducing numerous confounding variables when testing path integration. Also in this task, the performance of GluA1(-/-) mice was impaired. Next, we performed in vivo recordings in the MEC of GluA1(-/-) mice. MEC neurons exhibited altered grid cell spatial periodicity and reduced spatial selectivity, whereas head direction tuning and speed modulation were not affected. The firing associations between pairs of neurons in GluA1(-/-) mice were stable, both in time and space, indicating that attractor states were still present despite the lack of grid periodicity. Together, these results support the hypothesis that spatial representations in the hippocampal-entorhinal network contribute to path integration.

Keywords: entorhinal cortex; glutamate receptors; grid cells; hippocampus; navigation; path integration.


Figures

Figure 1.
Figure 1.
Homing with decreasing reliability and availability of allothetic cues. A, Schematics of the experimental design. The homing performance of mice in a food-carrying task was evaluated in a circular arena. At the beginning of each trial, a mouse was placed inside a home base below one of eight holes located at the rim of the arena. The mouse had to climb onto the arena to forage and bring a food pellet to its home base for consumption. The colored lines correspond to visual cues attached to a black curtain. The numbers around the arena indicate the identity of each hole. In the LF condition, the experimental room containing visual cues was illuminated and the position of the home base (Hb) was kept constant across trials (red arrow). In the LV condition, the room was illuminated and the home base position varied pseudo-randomly across trials. In the D condition, the light was turned off and the home base position varied pseudo-randomly across trials. Each condition lasted 5 d in which mice performed three daily trials. The position of the home base on individual trials is indicated below the diagrams. B, Examples of paths taken by control and GluA1−/− mice in the three conditions. Excursions on the arena were broken down into an outward path (i.e., the trajectory of a mouse from the home base until it took the food; gray lines) and a homing path (i.e., the trajectory of a mouse from the moment it took the food until it reached the home base or stopped at another place of the arena; blue lines). C, Number of incorrect homing paths (mean ±SEM), as the number of occasions when the mice took the food to a place other than the home base, performed by control and GluA1−/− mice in the three conditions. D, Straightness index for the outward paths (mean ±SEM) performed by control and GluA1−/− mice in the three conditions. E, Illustration of the homing angular deviation. We measured the angle between the two dotted lines connecting the center of the arena with the home base and the position at which the animal first reached the periphery of the arena during the homing path (red arrow). In this example, the angular deviation was 125°. F, Distribution of the angular deviations of homing paths (control: nLF = 210, nLV = 233, nD = 276; GluA1−/−: nLF = 202, nLV = 362, nD = 532) and (G) corresponding mean (±SEM) of control and GluA1−/− mice in the three conditions (control n = 10, GluA1−/− n = 9). *p < 0.05. **p < 0.005. ***p < 0.0001.
Figure 2.
Figure 2.
GluA1−/− mice showed a deficit in coping with decreasing reliability and availability of allothetic cues on a homing task. A, Distribution of the angular deviations of the homing paths (control n = 233, GluA1−/− n = 362) and corresponding mean (±SEM) of control and GluA1−/− mice in the LV condition using as reference the home base location of the LF condition. B, Schematics illustrating the calculation of the heading at periphery. Black and blue lines correspond to the outward and homing paths, respectively. Red dashed lines indicate the angular deviation of the homing path (a). Homing paths that had an absolute angular deviation between 20° and 60° were selected. A second angular deviation was calculated once the mouse ran 10 cm after reaching the periphery (green dashed lines, b). Heading at periphery was calculated as a − b. If a mouse ran toward the home base, the heading at periphery was positive (right). If a mouse ran away from the home base after reaching the periphery, the heading at periphery was negative (left). C, Distribution of the heading at periphery for control and GluA1−/− mice in the D condition (control n = 82, GluA1−/− n = 123). Angular deviation (mean ±SEM) for outward paths with (D) low and high complexity and (E) short and long duration in the D condition for control and GluA1−/− mice. Outward paths of low and high complexity corresponded to straightness index values higher and lower than 0.5, respectively. Outward paths with short and long duration correspond to duration values shorter and longer than 6.5 s, respectively (6.5 s was the median of the distribution of all outward paths). D, Dark. *p < 0.05. ***p < 0.0001.
Figure 3.
Figure 3.
GluA1−/− mice showed a deficit in path integration on an L-maze task. A, Schematics of the experimental design. Mice were trained to find a submerged platform at the end of three different corridors: Str (straight), L-S (long-short), and S-L (short-long), in which the platform was located at 0°, 30°, and 60° relative to the start box, respectively. During the test, the corridor was removed and the mice had to find the platform in the open tank. The experiment was performed in complete darkness. B, Examples of swimming paths by control and GluA1−/− mice in the Str, L-S, and S-L corridors. C, D, Mean heading (±SEM) at different distances from the start box for the three corridors for control (C) and GluA1−/− (D) mice. The area under the curve was compared within each genotype (see Materials and Methods). Dashed lines indicate the expected heading if mice computed path integration (i.e., swam in a straight line to the platform). E, F, Relationship between expected and observed heading (mean ±SEM) for control (E) and GluA1−/− (F) mice. The black diagonal line indicates a regression line of slope = 1. Control n = 9; GluA1−/− n = 9. **p = 0.007. ns, Not significant.
Figure 4.
Figure 4.
Histological examination of tetrode location in control and GluA1−/− mice. A, Sagittal sections stained with cresyl violet showing tetrode tracks reaching the MEC. Red circles represent the tips of the tetrodes. B, Dorsoventral (d-v) and mediolateral (m-l) coordinates of the tetrode tips in the MEC of control and GluA1−/− mice. The horizontal bar, the box, and the whiskers represent the median, the interquartile range, and the range, respectively. The location of the tetrode tips in control and GluA1−/− mice did not differ. C, Distribution of tetrode tips across different layers of the MEC in control and GluA1−/− mice.
Figure 5.
Figure 5.
Disruption of the grid cell spatial periodicity in the MEC of GluA1−/− mice. A, Trajectory with spike position, firing rate map, and spatial autocorrelation matrix of five grid cells recorded in control (left) and GluA1−/− mice (right). The numbers above the firing rate maps and spatial autocorrelation matrices represent the maximum firing rate and grid score for each cell, respectively. The spatial autocorrelation matrices of cells in GluA1−/− mice lack the periodic pattern of grid cells. B, Distribution of grid scores for principal cells in control and GluA1−/− mice. C, Mean (±SEM) grid score per mouse. D, Percentage of grid cells recorded in control and GluA1−/− mice. E, Firing rate maps of 10 neurons with the lowest and highest significant grid scores in both genotypes. Significance was tested using a shuffling procedure. The grid score of each neuron is indicated above its firing rate map. F, Mean (±SEM) information score (left) and grid score of neurons with different information scores (right). G, Mean (±SEM) number of firing fields per neuron in control and GluA1−/− mice (left). Grid score of neurons with various numbers of firing fields (right). ***p < 10−10. **p < 10−5.
Figure 6.
Figure 6.
Grid cell periodicity in GluA1−/− mice is not preserved over short time periods. A, Examples of three neurons in control and GluA1−/− mice. Leftmost column, Firing rate maps calculated from 40 min of data recorded during open-field exploration. Next 5 columns on the right, Dynamic firing rate maps constructed using time windows of 1–5 s. There is an absence of periodic firing fields in the dynamic firing rate maps of GluA1−/− mice. The corresponding spatial autocorrelations of the dynamic firing rate maps are presented in the last 5 columns on the right. Scale bars, 70 cm. B, Mean (±SEM) grid score in control and GluA1−/− mice calculated from dynamic firing rate maps with different time windows. The dynamic firing rate maps of GluA1−/− mice displayed less periodicity when time windows >2 s were used. C, Mean (±SEM) Pearson correlation coefficient between grid scores calculated from the time-averaged and dynamic firing rate maps. D, Percentage of grid cells found in control and GluA1−/− mice. Grid cells were identified using a shuffling procedure in which spikes were shifted on the path of the mouse before recalculating the dynamic firing rate maps. Fewer grid cells were observed in GluA1−/− mice with time windows of >2 s. ***p < 0.001. **p < 0.01. *p < 0.05.
Figure 7.
Figure 7.
Residual spatial firing in GluA1−/− mice is preserved in darkness. A, Examples of firing rate maps from six neurons in control and GluA1−/− mice tested with normal light illumination (left and right columns) or in darkness (middle column). B, Mean (±SEM) spatial sparsity during trials in the light (L) or darkness (D). C, Mean (±SEM) grid score during trials in the light or darkness. D, Mean (±SEM) map stability between two trials in the light (L1–L2) or between a trial in the light and in darkness (L1-D). Data are shown for cells with different degrees of spatial sparsity. Neurons in GluA1−/− mice were less spatially stable across trials.
Figure 8.
Figure 8.
Preserved head direction and running velocity signals in MEC neurons of GluA1−/− mice. A, Examples of four neurons in control and GluA1−/− mice with different head direction selectivity. Left to right, Trajectory with spike position, firing rate map, and directional plot. The directional plot shows the firing rate of the neurons when the head of the mouse points in different directions. B, Distribution of head direction selectivity (mean vector length) for MEC neurons in control and GluA1−/− mice. C, Percentage of cells for which the firing rate was significantly modulated by head direction. D, Relationship between the head direction selectivity and grid score. Most neurons with high grid scores in control mice had low head direction selectivity. E, Mean (±SEM) firing rate of neurons at different running speeds in control and GluA1−/− mice. Right, The firing rate of the neurons was normalized by their firing rate when the animal was immobile (running speed < 2.5 cm/s).
Figure 9.
Figure 9.
Theta rhythmicity in GluA1−/− mice. A, Spike-time autocorrelation for principal cells and interneurons recorded in control and GluA1−/− mice, ordered from the bottom to the top according to their theta rhythmicity index. Red and dark blue were assigned to the highest and lowest value, respectively, of each individual autocorrelation. Theta rhythmic activity was still present in mutant mice. B, Mean (±SEM) spike-time autocorrelation for principal cells and interneurons in control and GluA1−/− mice. C, Mean power spectrum of spike-time autocorrelations for principal cells and interneurons in control and GluA1−/− mice. Theta was the dominant rhythmic frequency in both control and GluA1−/− mice. D, Theta rhythmicity index for neurons in control and GluA1−/− mice. E, Peak theta frequency of neurons in control and GluA1−/− mice. F, Mean (±SEM) peak theta frequencies calculated when mice ran at different speeds. Theta peak frequencies in GluA1−/− mice were lower independently of running speed. ***p < 2.2−16.
Figure 10.
Figure 10.
Stable network states in GluA1−/− mice. A, Examples of three cell pairs recorded in control and GluA1−/− mice. For each pair: top row left, spike-time autocorrelation (from −100 to 100 ms) of both cells; top row middle, firing rate map of both cells; top row right, spike-time cross correlation (from −100 to 100 ms) between the two cells; bottom, instantaneous firing rate of the two cells during 120 s of exploration in the open-field. The firing association between the two cells is the correlation coefficient (r value) between the two instantaneous firing rate vectors. B, Time windows with different number of spikes. The recruitment of principal neurons in GluA1−/− mice was very similar to that of control mice. C, Distribution of firing associations between MEC neurons in control and GluA1−/− mice. The data from the first open-field trials are shown. The dotted lines indicate chance levels for pairs of control and GluA1−/− cells. In both genotypes, stronger negative and positive associations were observed compared with chance levels. D, Proportion of significantly negative and positive firing associations in control and GluA1−/− mice. +, positive firing associations; −, negative firing associations; NS, nonsignificant firing associations. E, Stability of firing associations. Top, Schematic of the analysis. Firing associations between recorded cells are represented by lines between the circles. The firing associations between cells were compared during two trials in the open field. Bottom, Correlations of firing associations observed during the two trials. Firing associations in GluA1−/− mice were as stable as those of control mice, despite a lack of grid cell periodicity and a reduction of spatial selectivity. F, Stability of firing associations as mice explored two nonoverlapping regions of the open field. In both genotypes, the firing associations were maintained across the two areas. Red and black dots represent cell pairs from GluA1−/− and control mice, respectively.

References

    1. Allen K, Fuchs EC, Jaschonek H, Bannerman DM, Monyer H. Gap junctions between interneurons are required for normal spatial coding in the hippocampus and short-term spatial memory. J Neurosci. 2011;31:6542–6552. doi: 10.1523/JNEUROSCI.6512-10.2011. - DOI - PMC - PubMed
    1. Bannerman DM, Deacon RM, Seeburg PH, Rawlins JN. GluR-A-deficient mice display normal acquisition of a hippocampus-dependent spatial reference memory task but are impaired during spatial reversal. Behav Neurosci. 2003;117:866–870. doi: 10.1037/0735-7044.117.4.866. - DOI - PubMed
    1. Blair HT, Gupta K, Zhang K. Conversion of a phase- to a rate-coded position signal by a three-stage model of theta cells, grid cells, and place cells. Hippocampus. 2008;18:1239–1255. doi: 10.1002/hipo.20509. - DOI - PMC - PubMed
    1. Boccara CN, Sargolini F, Thoresen VH, Solstad T, Witter MP, Moser EI, Moser MB. Grid cells in pre- and parasubiculum. Nat Neurosci. 2010;13:987–994. doi: 10.1038/nn.2602. - DOI - PubMed
    1. Bonnevie T, Dunn B, Fyhn M, Hafting T, Derdikman D, Kubie JL, Roudi Y, Moser EI, Moser MB. Grid cells require excitatory drive from the hippocampus. Nat Neurosci. 2013;16:309–317. doi: 10.1038/nn.3311. - DOI - PubMed

Publication types

MeSH terms

Substances

LinkOut - more resources