. 2014 May 1;37(5):999-1009.
doi: 10.5665/sleep.3678.

Sleep fragmentation in mice induces nicotinamide adenine dinucleotide phosphate oxidase 2-dependent mobilization, proliferation, and differentiation of adipocyte progenitors in visceral white adipose tissue

Affiliations

Sleep fragmentation in mice induces nicotinamide adenine dinucleotide phosphate oxidase 2-dependent mobilization, proliferation, and differentiation of adipocyte progenitors in visceral white adipose tissue

Abdelnaby Khalyfa et al. Sleep. .

Abstract

Background: Chronic sleep fragmentation (SF) without sleep curtailment induces increased adiposity. However, it remains unclear whether mobilization, proliferation, and differentiation of adipocyte progenitors (APs) occurs in visceral white adipose tissue (VWAT), and whether nicotinamide adenine dinucleotide phosphate (NADPH) oxidase 2 (Nox2) activity plays a role.

Methods: Changes in VWAT depot cell size and AP proliferation were assessed in wild-type and Nox2 null male mice exposed to SF and control sleep (SC). To assess mobilization, proliferation, and differentiation of bone marrow mesenchymal stem cells (BM-MSC), Sca-1+ bone marrow progenitors were isolated from GFP+ or RFP+ mice, and injected intravenously to adult male mice (C57BL/6) previously exposed to SF or SC.

Results: In comparison with SC, SF was associated with increased weight accrual at 3 w and thereafter, larger subcutaneous and visceral fat depots, and overall adipocyte size at 8 w. Increased global AP numbers in VWAT along with enhanced AP BrDU labeling in vitro and in vivo emerged in SF. Systemic injections of GFP+ BM-MSC resulted in increased AP in VWAT, as well as in enhanced differentiation into adipocytes in SF-exposed mice. No differences occurred between SF and SC in Nox2 null mice for any of these measurements.

Conclusions: Chronic sleep fragmentation (SF) induces obesity in mice and increased proliferation and differentiation of adipocyte progenitors (AP) in visceral white adipose tissue (VWAT) that are mediated by increased Nox2 activity. In addition, enhanced migration of bone marrow mesenchymal stem cells from the systemic circulation into VWAT, along with AP differentiation, proliferation, and adipocyte formation occur in SF-exposed wild-type but not in oxidase 2 (Nox2) null mice. Thus, Nox2 may provide a therapeutic target to prevent obesity in the context of sleep disorders.

Keywords: adipocyte progenitor cells; adipose tissue; obesity; oxidative stress; sleep fragmentation.


Figures
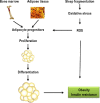
Figure 1
Figure 1
Schematic diagram illustrating the working hypothesis of the current study. Sleep fragmentation will induce the generation of oxidative stress via activation of nicotinamide adenine dinucleotide phosphate (NADPH) oxidase in visceral white adipose tissue. Increased reactive oxygen species (ROS) in adipose tissue lead to mobilization of adipocyte progenitors residing in adipose tissue or from bone marrow and their proliferation and differentiation into adipocytes. Increased visceral white adipose tissue mass will then promote obesity and appearance of insulin resistance.
Figure 2
Figure 2
(A) Time course of body weight gain in wild-type (WT) and Nox2 null mice (Nox2) exposed to either sleep fragmentation (SF) or control sleep condition (SC) for 8 w. Increased weight gain became apparent starting at 3 w after initiation of SF and thereafter. (B) Representative visceral (yellow) and subcutaneous (green) fat content in the abdominal section of WT and Nox2 mice subjected to either SF or SC for 8 w. Magnetic resonance images underwent three-dimensional reconstruction using AMIRA software. These images are representative of five to six mice/experimental group. (C) Mean distribution of adipocyte diameters as measured from three random fields of hematoxylin and eosin-stained paraffin sections from visceral white adipose tissue (n > 150 adipocytes per animal, per group) averaged from three mice/group after 6 w of each experimental condition. Shifts toward larger adipocyte diameters are clearly apparent in SF-exposed wild type mice, but no changes emerged in Nox2 null mice.
Figure 3
Figure 3
Gating strategy for adipocyte progenitor (AP) cells enumerated as Lin:CD29+:CD34+:Sca-1+:CD24+ cells, and representative experiment of the percentage of AP cells in visceral white adipose tissue (VWAT) of a wild-type (WT) mouse exposed to sleep fragmentation (SF) for 2 w and a time-matched sleep control (SC). The right panel depicts the summary of six different experiments in WT and Nox2 null mice exposed to either SF or SC for 2 w. Significant increases in AP cell counts in VWAT emerged only in WT mice exposed to SF.
Figure 4
Figure 4
Representative images of adipocyte progenitor (AP) cells harvested from the stromal vascular fraction (SVF) of visceral white adipose tissue in mice exposed to sleep control (SC, upper panels) or sleep fragmentation (SF, lower panels) in cell culture under undifferentiating media conditions (A, B), differentiating media (C, D), Oil Red O staining (E, F), and after pulsing with 5-bromo-2'-deoxyuridine (BrDU; nuclei are stained in blue and BrDU in green) (G, H). The bar graph shows the mean BrDU cell counts/field for AP cells cultured from wild-type (WT) and Nox2 mice exposed to either SF or SC (n = 6 experiments/group).
Figure 5
Figure 5
Representative images of BrDU immunoreactive cells in visceral white adipose tissue (VWAT) after phosphate buffered saline (PBS) or intraperitoneal BrDU treatment of wild-type (WT) mice exposed to either sleep fragmentation (SF) or sleep control (SC) for 2 w. The bar graph shows the mean number of BrDU+ cells/section in VWAT (n = 6 sections/mouse and n = 5 mice/group). Increased BrDU incorporation was apparent only in WT mice exposed to SF. Arrows in D represent examples of positive labeling. Horizontal bars in A-D indicate magnification scale and represent 100 micrometers.
Figure 6
Figure 6
(I) Representative images of visceral white adipose tissue (VWAT) from 1-w sleep fragmentation (SF)- or sleep control (SC)-exposed wild-type (WT) mice 1 w (C and D) and 3 w (E and F) after intravenous injection of 4 × 10 GFP + bone marrow Sca1+ cells via the tail vein. Panels A and B represent unbiased quantitative assessment of mean fluorescence intensity (MFI) for sections after 1 w after injection of Sca-1+ cells and panels G and H for sections obtained 3 weeks after intravenous injection. (II) The right upper graph depicts the number of BrDU+GFP+ or BrDU+RFP+ cells in VWAT from WT and Nox2 null mice exposed to SF or SC for 1 w and injected with Sca-1+ cells, 1 w after injection. (III) The right lower panel shows MFI of VWAT sections from WT and Nox2 null mice exposed to SF or SC for 1 w and injected with Sca-1+ cells at 1 w (filled columns) and 3 w (hashed columns) after injection. BrDU, 5-bromo-2'-deoxyuridine. Horizontal bars in E and F indicate magnification scale and represent 100 micrometers.
Figure 7
Figure 7
Representative perilipin immunostaining and hematoxylin and eosin counterstaining of visceral white adipose tissue sections from wild-type mice exposed to sleep fragmentation (SF) or sleep control (SC) for 1 w and injected with Sca-1+ cells, 1 w and 3 w after injection. (n = 3/condition.) Horizontal bars in A-D indicate magnification scale and represent 100 micrometers.

References

    1. Rosekind MR. Underestimating the societal costs of impaired alertness: safety, health and productivity risks. Sleep Med. 2005:S21–5. - PubMed
    1. Cappuccio FP, Taggart FM, Kandala NB, et al. Meta-analysis of short sleep duration and obesity in children and adults. Sleep. 2008;31:619–26. - PMC - PubMed
    1. Pejovic S, Vgontzas AN, Basta M, et al. Leptin and hunger levels in young healthy adults after one night of sleep loss. J Sleep Res. 2010;19:552–8. - PMC - PubMed
    1. Buxton OM, Cain SW, O'Connor SP, et al. Adverse metabolic consequences in humans of prolonged sleep restriction combined with circadian disruption. Sci Transl Med. 2012;4:129ra43. - PMC - PubMed
    1. Greer SM, Goldstein AN, Walker MP. The impact of sleep deprivation on food desire in the human brain. Nat Commun. 2013;4:2259. - PMC - PubMed

Publication types

MeSH terms