

Unravelling the architecture of functional variability in wild populations of Polygonum viviparum L
- PMID: 24790285
- PMCID: PMC4001464
- DOI: 10.1111/1365-2435.12034
Unravelling the architecture of functional variability in wild populations of Polygonum viviparum L
Abstract
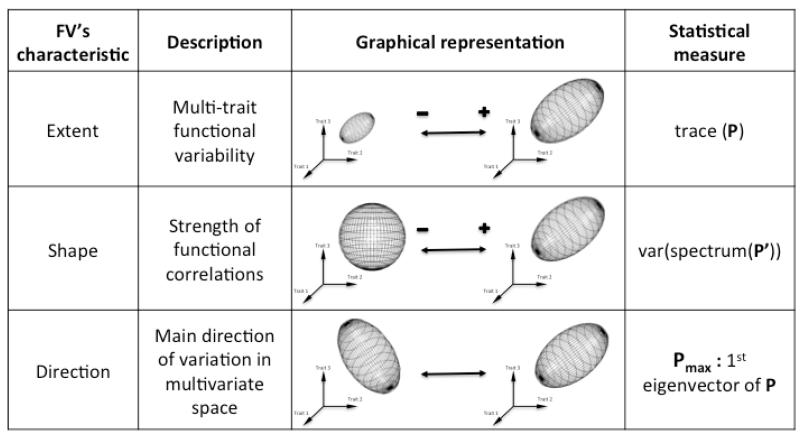
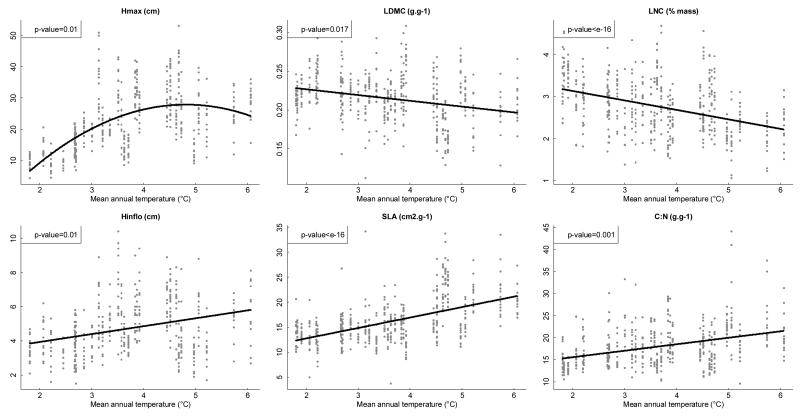
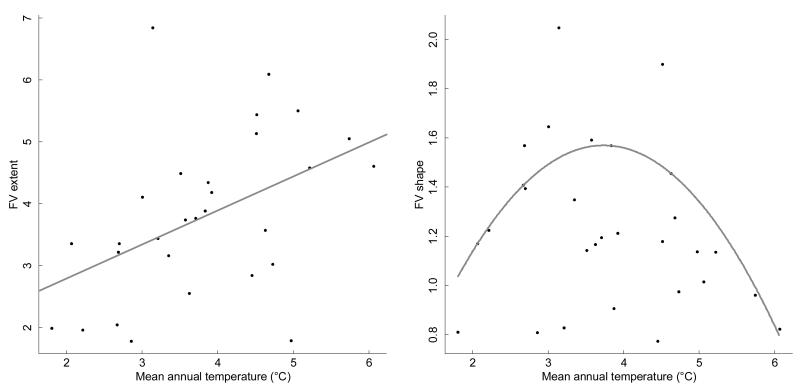
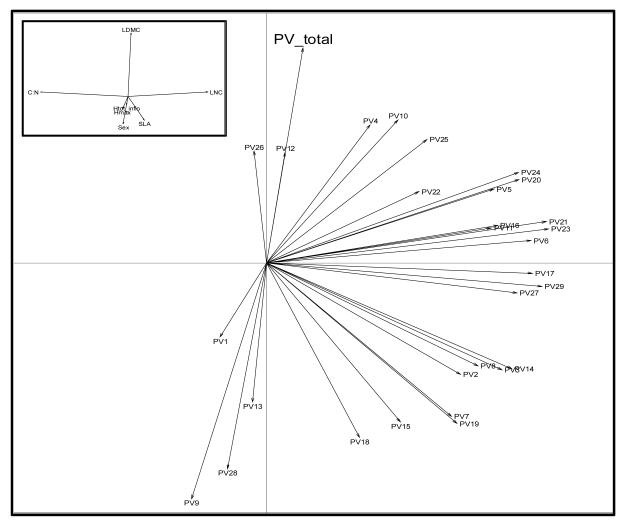
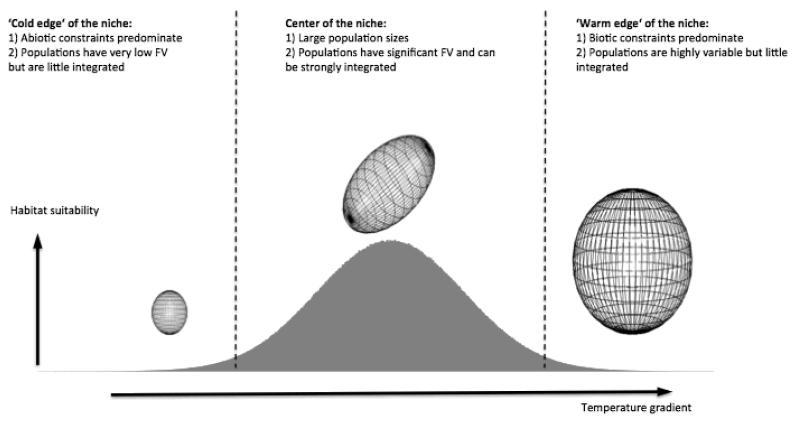
Functional variability (FV) of populations can be decomposed into three main features: the individual variability of multiple traits, the strength of correlations between those traits and the main direction of these correlations, the latter two being known as 'phenotypic integration'. Evolutionary biology has long recognized that FV in natural populations is key to determining potential evolutionary responses, but this topic has been little studied in functional ecology.Here we focus on the arctico-alpine perennial plant species Polygonum viviparum L.. We used a comprehensive sampling of seven functional traits in 29 wild populations covering the whole environmental niche of the species. The niche of the species was captured by a temperature gradient, which separated alpine stressful habitats from species-rich, competitive sub-alpine ones. We seeked to assess the relative roles of abiotic stress and biotic interactions in shaping different aspects of functional variation within and among populations, that is, the multi-trait variability, the strength of correlations between traits, and the main directions of functional trade-offs.Populations with the highest extent of functional variability were found in the warm end of the gradient whereas populations exhibiting the strongest degree of phenotypic integration were located in sites with intermediate temperatures. This could reveal both the importance of environmental filtering and population demography in structuring FV. Interestingly, we found that the main axes of multivariate functional variation were radically different within and across population.Although the proximate causes of FV structure remain uncertain, our study presents a robust methodology for the quantitative study of functional variability in connection with species' niches. It also opens up new perspectives for the conceptual merging of intraspecific functional patterns with community ecology.
Keywords: alpine plants; ecological niche; functional traits; intraspecific variation; lines of least resistance; phenotypic integration; variance-covariance matrix.
Figures
References
-
- Ackerly DD, Dudley SA, Sultan SE, Schmitt J, Coleman JS, Linder R, Sandquist DR, Geber MA, Evans AS, Dawson TE, Lechowicz MJ. The evolution of plant ecophysiological traits: recent advances and future directions. BioScience. 2000;50:979–995.
-
- Albert CH, Thuiller W, Yoccoz NG, Douzet R, Aubert S, Lavorel S. A multi-trait approach reveals the structure and the relative importance of intra- vs. interspecific variability in plant traits. Functional Ecology. 2010a;24:1192–1201.
-
- Albert CH, Thuiller W, Yoccoz NG, Soudant A, Boucher F, Saccone P, Lavorel S. Intraspecific functional variability: extent, structure and sources of variation. Journal of Ecology. 2010b;98:604–613.
-
- Albert CH, Yoccoz NG, Edwards TC, Graham CH, Zimmermann NE, Thuiller W. Sampling in ecology and evolution - bridging the gap between theory and practice. Ecography. 2010c;33:1028–1037.
-
- Armbruster WS, Pelabon C, Hansen TF, Bolstad GH. Macroevolutionary patterns of pollination accuracy: a comparison of three genera. New Phytologist. 2009;183:600–617. - PubMed
Grants and funding
LinkOut - more resources
Full Text Sources
Other Literature Sources