Functional neuro-imaging as a pre-surgical tool in epilepsy
- PMID: 24791091
- PMCID: PMC4001213
- DOI: 10.4103/0972-2327.128659
Functional neuro-imaging as a pre-surgical tool in epilepsy
Abstract
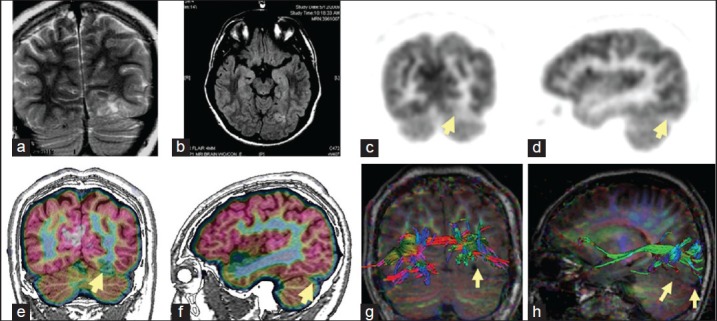
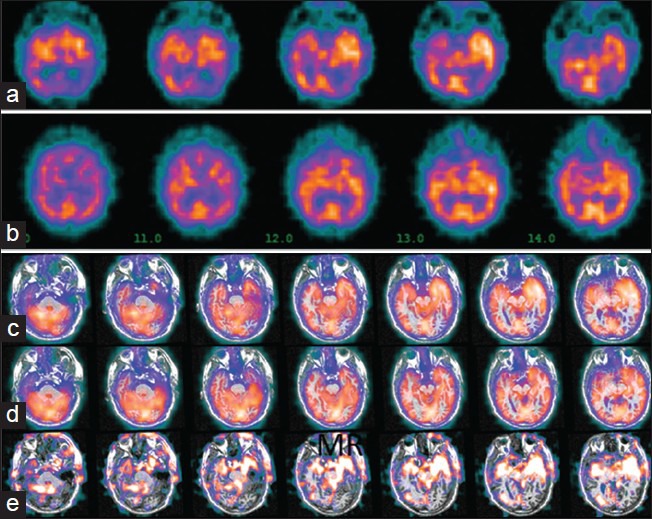
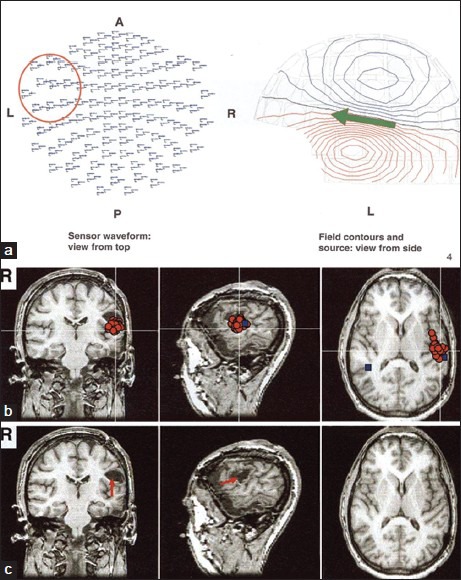
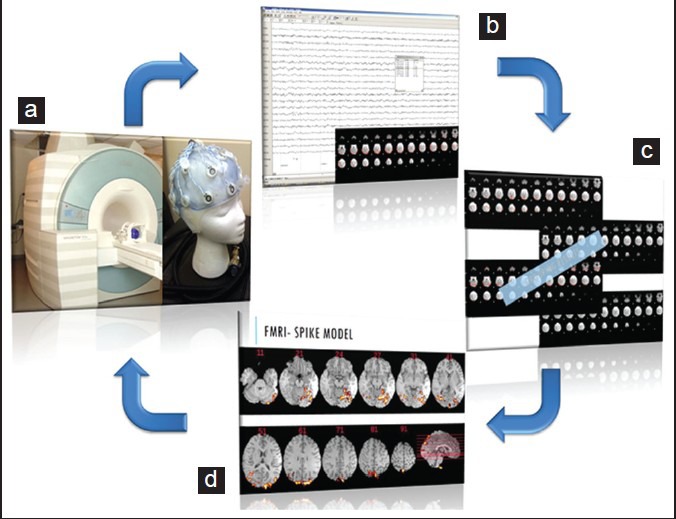
Functional neuro-imaging techniques are helpful in the pre-surgical evaluation of epilepsy for localization of the epileptogenic zone as ancillary tools to electroencephalography (EEG) and magnetic resonance imaging (MRI) or when other localization techniques are normal, non-concordant or discordant. Positron emission tomography (PET) and ictal single photon emission computed tomography (ictal SPECT) imaging are traditional tests that have been reported to have good sensitivity and specificity although the results are better with more expertise as is true for any technique. More recently magnetoencephalogram/magnetic source imaging (MEG/MSI), diffusion tensor imaging and functional magnetic resonance imaging (fMRI) have been used in localization and functional mapping during the pre-surgical work-up of epilepsy. Newer techniques such as fMRI-EEG, functional connectivity magnetic resonance imaging and near infra-red spectroscopy, magnetic resonance spectroscopy and magneto nanoparticles hold promise for further development that could then be applied in the work-up of epilepsy surgery. In this manuscript, we review these techniques and their current position in the pre-surgical evaluation of epilepsy.
Keywords: Diffusion tensor imaging; functional connectivity magnetic resonance imaging; functional magnetic resonance imaging; functional magnetic resonance imaging-electroencephalography; magnetoencephalogram; positron emission tomography; single photon emission computed tomography; temporal lobe epilepsy.
Conflict of interest statement
Figures
Similar articles
-
Identifying the epileptogenic zone by four non-invasive imaging techniques versus stereo-EEG in MRI-negative pre-surgery epilepsy patients.Clin Neurophysiol. 2020 Aug;131(8):1815-1823. doi: 10.1016/j.clinph.2020.05.015. Epub 2020 Jun 3. Clin Neurophysiol. 2020. PMID: 32544836
-
Interictal and ictal source localization for epilepsy surgery using high-density EEG with MEG: a prospective long-term study.Brain. 2019 Apr 1;142(4):932-951. doi: 10.1093/brain/awz015. Brain. 2019. PMID: 30805596 Free PMC article.
-
Comparison of MR imaging with PET and ictal SPECT in 118 patients with intractable epilepsy.AJNR Am J Neuroradiol. 1999 Apr;20(4):593-9. AJNR Am J Neuroradiol. 1999. PMID: 10319968 Free PMC article.
-
Neuroimaging techniques in epilepsy.Hong Kong Med J. 2010 Aug;16(4):292-8. Hong Kong Med J. 2010. PMID: 20683073 Review.
-
Neuronuclear assessment of patients with epilepsy.Semin Nucl Med. 2008 Jul;38(4):227-39. doi: 10.1053/j.semnuclmed.2008.02.004. Semin Nucl Med. 2008. PMID: 18514079 Review.
Cited by
-
International Veterinary Epilepsy Task Force recommendations for a veterinary epilepsy-specific MRI protocol.BMC Vet Res. 2015 Aug 28;11:194. doi: 10.1186/s12917-015-0466-x. BMC Vet Res. 2015. PMID: 26319136 Free PMC article.
-
Integrated Proteomics and Protein Co-expression Network Analysis Identifies Novel Epileptogenic Mechanism in Mesial Temporal Lobe Epilepsy.Mol Neurobiol. 2024 Nov;61(11):9663-9679. doi: 10.1007/s12035-024-04186-5. Epub 2024 Apr 30. Mol Neurobiol. 2024. PMID: 38687446
-
Computer-automated focus lateralization of temporal lobe epilepsy using fMRI.J Magn Reson Imaging. 2015 Jun;41(6):1689-94. doi: 10.1002/jmri.24696. Epub 2014 Jul 9. J Magn Reson Imaging. 2015. PMID: 25044773 Free PMC article.
-
Imaging episodic memory during development and childhood epilepsy.J Neurodev Disord. 2018 Dec 13;10(1):40. doi: 10.1186/s11689-018-9255-8. J Neurodev Disord. 2018. PMID: 30541437 Free PMC article. Review.
-
Functional Connectivity Derived From Electroencephalogram in Pharmacoresistant Epileptic Encephalopathy Using Cannabidiol as Adjunctive Antiepileptic Therapy.Front Behav Neurosci. 2021 Feb 23;15:604207. doi: 10.3389/fnbeh.2021.604207. eCollection 2021. Front Behav Neurosci. 2021. PMID: 33708077 Free PMC article.
References
-
- Knowlton RC. The role of FDG-PET, ictal SPECT, and MEG in the epilepsy surgery evaluation. Epilepsy Behav. 2006;8:91–101. - PubMed
-
- Juhász CC, Chugani DC, Muzik O, Chugani HT. Positron-emisson tomography in epilepsy. In: Kuzniecky RI, Jackson GD, editors. Magnetic Resonance in Epilepsy: Neuroimaging Techniques. 2nd ed. Oxford: Elsevier; 2005. pp. 395–411.
-
- Goffin K, Dedeurwaerdere S, Van Laere K, Van Paesschen W. Neuronuclear assessment of patients with epilepsy. Semin Nucl Med. 2008;38:227–39. - PubMed
LinkOut - more resources
Full Text Sources
Other Literature Sources