. 2014 Apr 27:20:575-92.
eCollection 2014.

Multimodal analysis of the progression of Best vitelliform macular dystrophy

Affiliations

Multimodal analysis of the progression of Best vitelliform macular dystrophy

Giuseppe Querques et al. Mol Vis. .

Abstract

Purpose: To investigate the multimodal morphological features in the different stages of Best vitelliform macular dystrophy (VMD) in subjects harboring mutations in the BEST1 gene, and their changes during the progression of the disease.

Methods: In this retrospective observational study performed between January 2007 and December 2012, 21 patients (42 eyes) with Best VMD from eight families with the BEST1 mutation were included. Best-corrected visual acuity (BCVA), fundus autofluorescence (FAF), and spectral domain optical coherence tomography (SDOCT) were evaluated at study entry and at last visit.

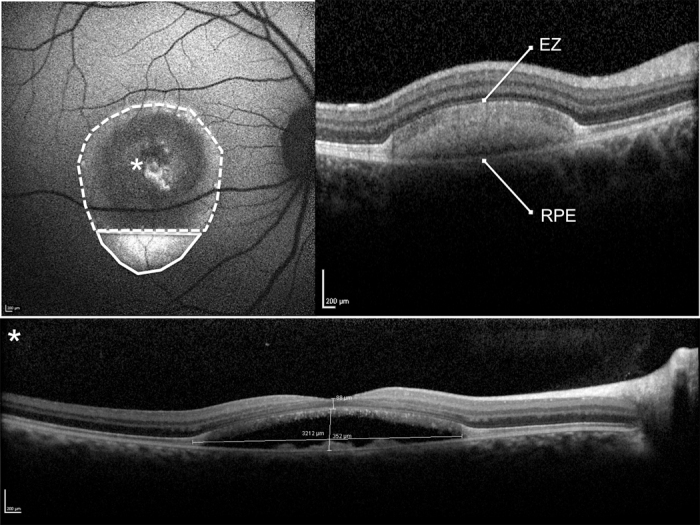
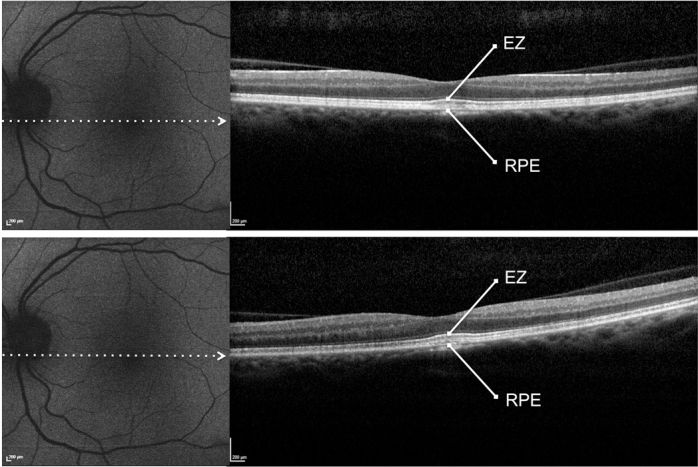
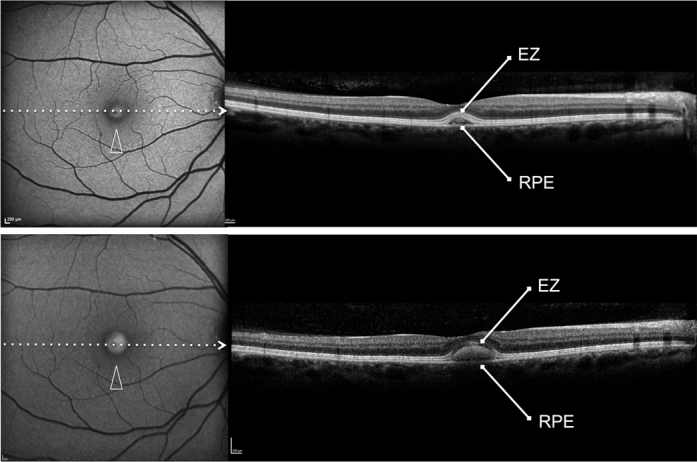
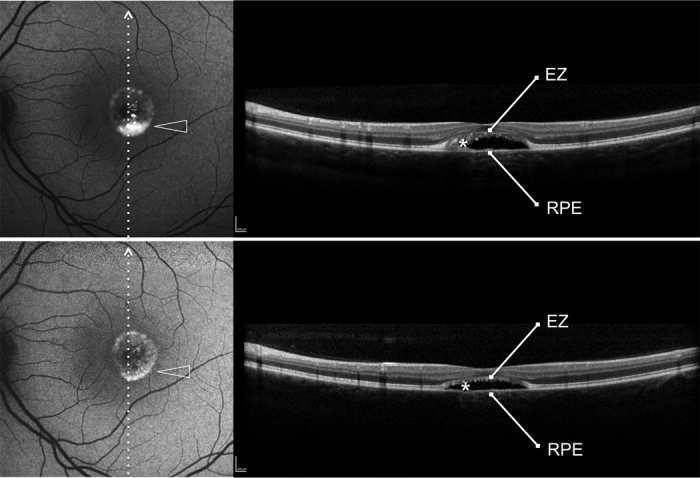
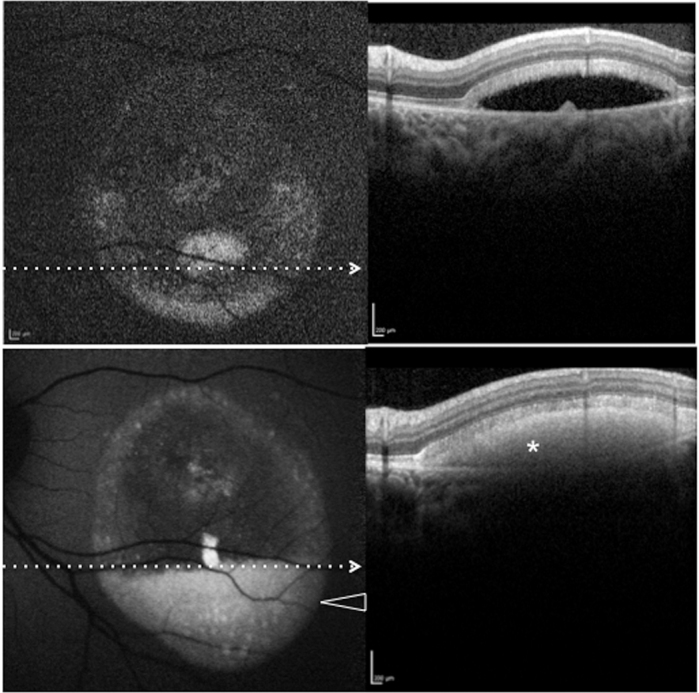
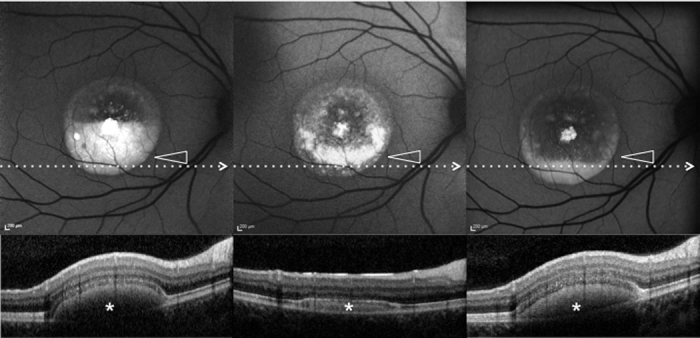
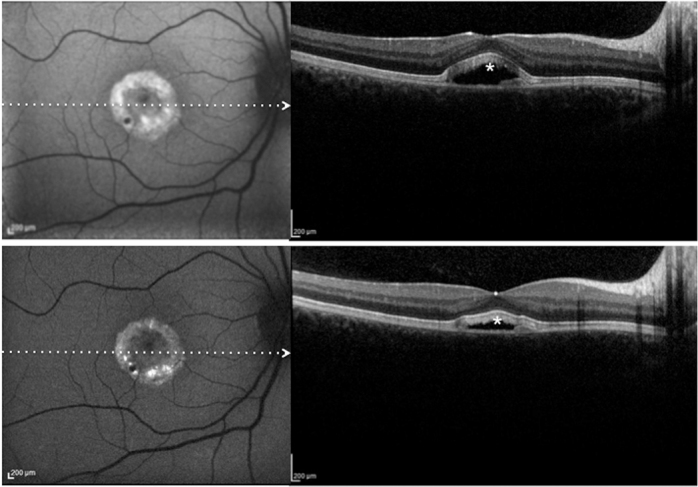
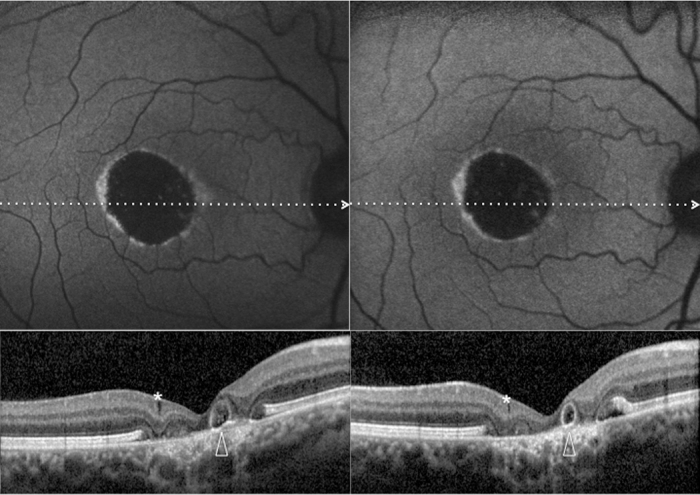
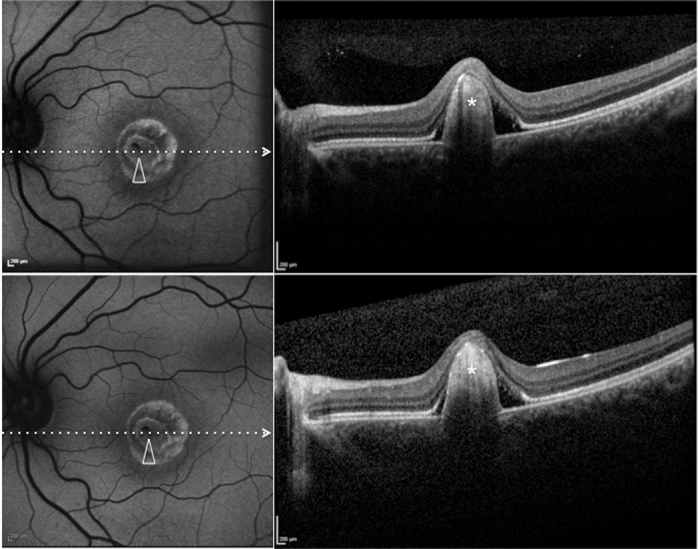
Results: The mean age of patients was 26.3±17.4 years. Seven new missense mutations in BEST1 were identified. Mean follow-up was 41.1±18.5 months. Mean BCVA was 0.34±0.34 LogMAR at study entry and 0.32±0.33 LogMAR at last follow-up visit (p = 0.2). The overall lesion area on FAF increased from 6.62±4.9 mm² to 7.34±6.1 mm² (p = 0.05). At study entry, on SD-OCT, photoreceptor inner segment ellipsoid portion (ellipsoid zone, EZ) was normal in 15 eyes, disrupted in 14 eyes, and absent in 13 eyes. In two eyes, EZ changed from normal to disrupted during follow-up. Three eyes of three patients showing pseudohypopyon lesions at study entry progressed to vitelliruptive lesions at the last follow-up visit. Three eyes of three patients showing vitelliruptive lesion at study entry reverted to pseudohypopyon lesion with overall enlargement of the lesion size.

Conclusions: Multimodal analysis allowed documenting a continuous material accumulation and reabsorption in Best VMD progression. Blue FAF and SD-OCT could represent noninvasive imaging techniques to monitor Best VMD.


Figures

Figure 1
Figure 1
Blue fundus autofluorescence (FAF) and spectral-domain optical coherence tomography (SD-OCT) of a pseudohypopyon lesion. Illustration of the per protocol evaluation of the hyperautofluorescent (area encircled by a continuous line) and hypoautofluorescent (area encircled by a dotted line) components of the lesion were measured using the measured using the Heidelberg software (top left panel). The overall lesion area is the sum of the hyperautofluorescent and hypoautofluorescent areas. The SD-OCT scan shows the hyper-reflective dome-shaped material located in the subretinal space, between the hyper-reflective photoreceptor inner segment (IS) ellipsoid portion (ellipsoid zone, EZ) and the hyperreflective retinal pigment epithelium (RPE)/Bruch’s membrane complex, matching with the hyperautofluorescent component of the lesion located inferiorly. The SD-OCT scan through the fovea (asterisk) shows the partial reabsorption of the hyperreflective material and replacement by a hyporeflective fluid component (bottom panel). The thickness of the neurosensory retina at the fovea and maximal thickness and width of the lesion was measured using the caliper provided with the Heidelberg software (bottom panel).
Figure 2
Figure 2
Patient #9. Blue fundus autofluorescence (FAF) and spectral-domain optical coherence tomography (SD-OCT) reveal the left eye affected with previtelliform lesion at both study entry and last follow-up visit (50 months later). Blue FAF frames show no increased macular autofluorescence at either study entry (top left panel) or the last follow-up visit (bottom left panel). SD-OCT scans show a slight thickening of the hyperreflective band located between the hyperreflective photoreceptor inner segment (IS) ellipsoid portion (ellipsoid zone, EZ) and the hyperreflective retinal pigment epithelium (RPE)/Bruch’s membrane complex at study entry (top right panel) and the last follow-up visit (bottom right panel).
Figure 3
Figure 3
Patient #2. Blue fundus autofluorescence (FAF) and spectral-domain optical coherence tomography (SD-OCT) reveal the right eye affected with vitelliform lesion at both study entry and last follow-up visit (61 months later). Blue FAF frames show a highly autofluorescent macular lesion at study entry (top left panel, arrowhead), which was enlarged at the last follow-up visit (bottom left panel, arrowhead). SD-OCT scans show a hyperreflective dome-shaped lesion located in the subretinal space, between the hyperreflective photoreceptor inner segment (IS) ellipsoid portion (ellipsoid zone, EZ) and the hyperreflective retinal pigment epithelium (RPE)/Bruch’s membrane complex at study entry (top right panel), which had increased at the last follow-up visit (bottom right panel).
Figure 4
Figure 4
Patient #16.Blue fundus autofluorescence (FAF) and spectral-domain optical coherence tomography (SD-OCT) reveal the left eye affected with pseudohypopyon lesion at study entry and vitelliruptive lesion last follow-up visit (12 months later). Blue FAF frames and SD-OCT scans at study entry (top left and top right panels) show a partial reabsorption of the hyperautofluorescent (arrowhead)/hyperreflective material (asterisk) located between the hyperreflective photoreceptor inner segment (IS) ellipsoid portion (ellipsoid zone, EZ) and the hyperreflective retinal pigment epithelium (RPE)/Bruch’s membrane complex, and replacement by a fluid component. At the last follow-up visit, blue FAF frames and SD-OCT scans (bottom left and bottom right panels) show further reabsorption of the hyperautofluorescent (arrowhead)/hyperreflective material (asterisk).
Figure 5
Figure 5
Patient #18. Blue fundus autofluorescence (FAF) and spectral-domain optical coherence tomography (SD-OCT) reveal the left eye affected with pseudohypopyon lesion at study entry and vitelliruptive lesion last follow-up visit (63 months later). Blue FAF frames and SD-OCT scans at study entry (top left and top right panels) show almost complete absence (reabsorption) of the autofluorescent/hyperreflective material, which has been replacement by a fluid component. At the last follow-up visit, blue FAF frames and SD-OCT scans (bottom left and bottom right panels) show development of the hyperautofluorescent (arrowhead)/hyperreflective material (asterisk).
Figure 6
Figure 6
Patient #1.Blue fundus autofluorescence (FAF) and spectral-domain optical coherence tomography (SD-OCT) reveal the right eye affected with pseudohypopyon lesion at both study entry and last follow-up visit (61 months later). Blue FAF frames and SD-OCT scans at study entry (top left and bottom right panels) show a partial reabsorption of the hyperautofluorescent (arrowhead)/hyperreflective material (asterisk) and replacement by a fluid component. During follow-up, blue FAF frames and SD-OCT scans (top middle and bottom middle panels) show further reabsorption of the hyperautofluorescent (arrowhead)/hyperreflective material (asterisk). At the last follow-up visit, blue FAF frames and SD-OCT scans (top left and bottom right panels) show development of the hyperautofluorescent (arrowhead)/hyper-reflective material (asterisk).
Figure 7
Figure 7
Patient #21.Blue fundus autofluorescence (FAF) and spectral-domain optical coherence tomography (SD-OCT) reveal the right eye affected with vitelliruptive lesion at both study entry and last follow-up visit (50 months later). Blue FAF frames and SD-OCT scans at study entry (top left and bottom right panels) show reabsorption of the hyperautofluorescent/hyperreflective subretinal material (asterisk) and replacement by a fluid component. At the last follow-up visit, blue FAF remained almost unchanged (top right panel), while SD-OCT showed a decrease in subretinal fluid (asterisk; bottom right panel).
Figure 8
Figure 8
Patient #5.Blue fundus autofluorescence (FAF) and spectral-domain optical coherence tomography (SD-OCT) reveal the right eye affected with atrophic lesion at both study entry and last follow-up visit (38 months later). At study entry (top left and bottom left panels), blue FAF frames show reduced autofluorescence (with some residual dispersed autofluorescent material), and SD-OCT shows atrophic changes (diffuse loss of photoreceptor and other sensory retina layers, with retinal pseudocysts [asterisk] and outer retinal tabulation [arrowhead]) within the area previously occupied by the yellowish material. Blue FAF and SD-OCT findings appear unchanged at the last follow-up visit (top right and bottom right panels). Note the presence of a hyperautofluorescent ring.
Figure 9
Figure 9
Patient #6. Blue fundus autofluorescence (FAF) and spectral-domain optical coherence tomography (SD-OCT) reveal the right eye affected with fibrotic lesion at both study entry and last follow-up visit (24 months later). At study entry (top left and top right panels), blue FAF frames show central (arrowhead) reduced autofluorescence (with some residual dispersed autofluorescent material), and SD-OCT shows a prominent highly hyperreflective thickening at retinal pigment epithelium level, inducing marked anterior bulging, accompanied by diffuse loss and thinning of the sensory retina (asterisk). Blue FAF and SD-OCT findings appear unchanged at the last follow-up visit (bottom left and bottom right panels). Note the presence of a hyperautofluorescent ring.

Similar articles

Cited by

References

    1. Best F. Uber eine hereditare maculaafektion; Beitrage zur verergslehre. Zschr Augenheilkunde. 1905;13:199–212.
    1. Stone EM, Nichols BE, Streb LM, Kimura AE, Sheffield VC. Genetic linkage of vitelliform macular degeneration Best's disease to chromosome 11q13. Nat Genet. 1992;1:246–50. - PubMed
    1. Petrukhin K, Koisti MJ, Bakall B, Li W, Xie G, Marknell T, Sandgren O, Forsman K, Holmgren G, Andreasson S, Vujic M, Bergen AA, McGarty-Dugan V, Figueroa D, Austin CP, Metzker ML, Caskey CT, Wadelius C. Identification of the gene responsible for Best macular dystrophy. Nat Genet. 1998;19:241–7. - PubMed
    1. Sun H, Tsunenari T, Yau KW, Nathans J. The vitelliform macular dystrophy protein defines a new family of chloride channels. Proc Natl Acad Sci USA. 2002;99:4008–13. - PMC - PubMed
    1. Kaufman SJ, Goldberg MF, Orth DH, Fishman GA, Tessler H, Mizuno K. Autosomal dominant vitreoretinochoroidopathy. Arch Ophthalmol. 1982;100:272–8. - PubMed

LinkOut - more resources