. 2014 Jun 1;23(6):620-632.
doi: 10.1111/geb.12137.

Scale decisions can reverse conclusions on community assembly processes

Affiliations

Scale decisions can reverse conclusions on community assembly processes

Tamara Münkemüller et al. Glob Ecol Biogeogr. .

Abstract

Aim: Phylogenetic diversity patterns are increasingly being used to better understand the role of ecological and evolutionary processes in community assembly. Here, we quantify how these patterns are influenced by scale choices in terms of spatial and environmental extent and organismic scales.

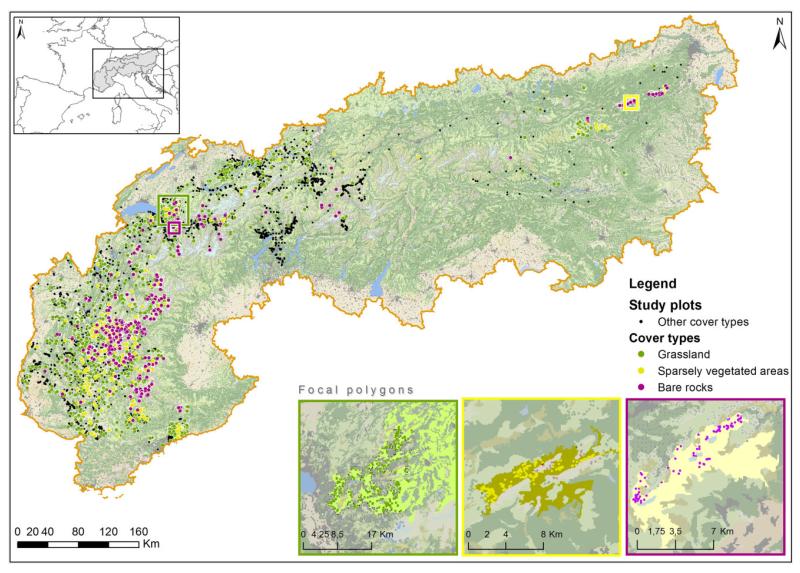
Location: European Alps.

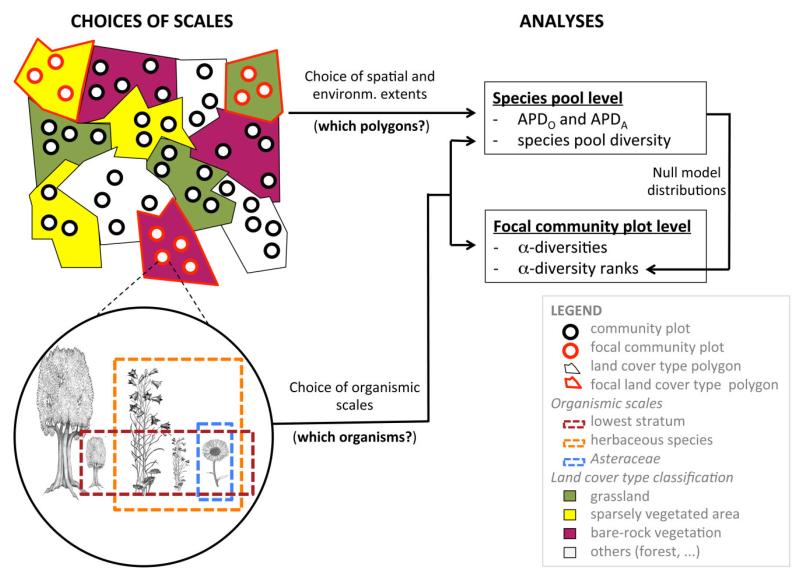
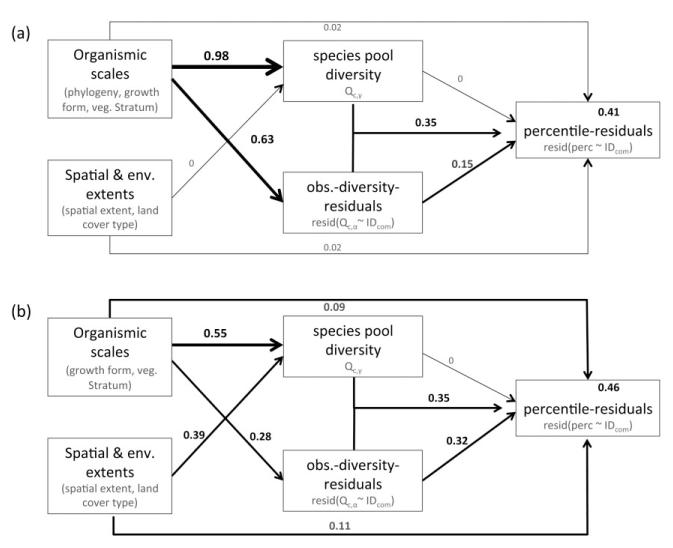
Methods: We applied 42 sampling strategies differing in their combination of focal scales. For each resulting sub-dataset, we estimated the phylogenetic diversity of the species pools, phylogenetic α-diversities of local communities, and statistics commonly used together with null models in order to infer non-random diversity patterns (i.e. phylogenetic clustering versus over-dispersion). Finally, we studied the effects of scale choices on these measures using regression analyses.

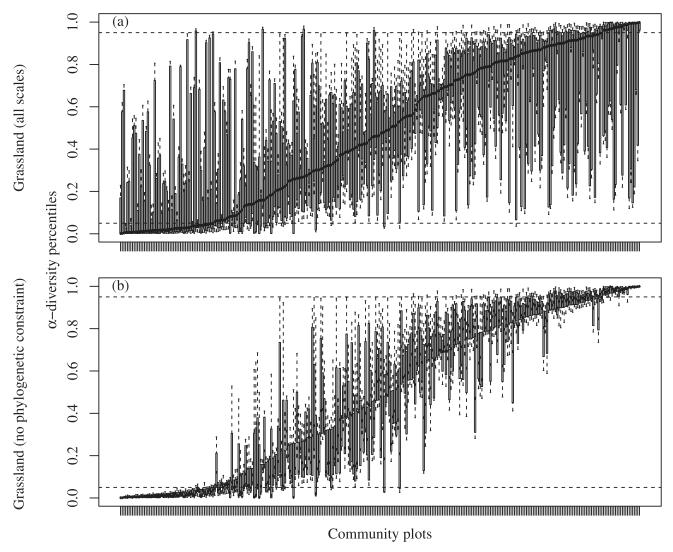
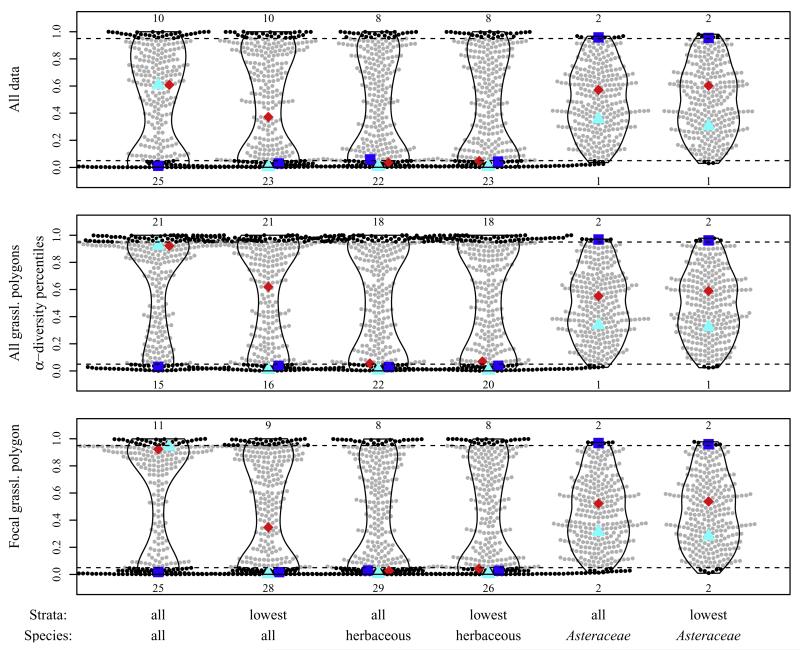
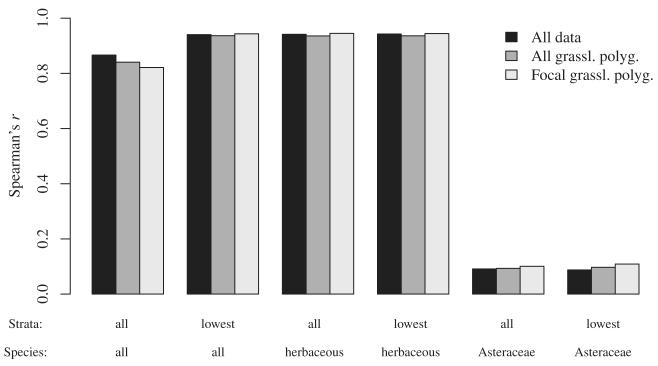
Results: Scale choices were decisive for revealing signals in diversity patterns. Notably, changes in focal scales sometimes reversed a pattern of over-dispersion into clustering. Organismic scale had a stronger effect than spatial and environmental extent. However, we did not find general rules for the direction of change from over-dispersion to clustering with changing scales. Importantly, these scale issues had only a weak influence when focusing on regional diversity patterns that change along abiotic gradients.

Main conclusions: Our results call for caution when combining phylogenetic data with distributional data to study how and why communities differ from random expectations of phylogenetic relatedness. These analyses seem to be robust when the focus is on relating community diversity patterns to variation in habitat conditions, such as abiotic gradients. However, if the focus is on identifying relevant assembly rules for local communities, the uncertainty arising from a certain scale choice can be immense. In the latter case, it becomes necessary to test whether emerging patterns are robust to alternative scale choices.

Keywords: Alpha diversity; assembly rules; community ecology; ecophylogenetics; null models; sampling design.


Figures

Figure 1
Figure 1. Map of the study area with the three focal land-cover types, the three focal polygons and their focal community plots.
Figure 2
Figure 2. Schematic overview of the scale choices and their influence on the composition of the species pools and the diversity of the focal community plots.
For example, when the constraints include reducing the environmental extent to only grasslands and the organismic scale to only herbaceous species in the lowest stratum, then α-diversity is calculated by considering only herbaceous species from the lowest stratum in the focal grassland polygon (three community plots in the overview figure). In this case, α-diversity-percentiles are calculated based on a species pool that contains all community plots from the grassland polygons (12 community plots in three polygons in the overview figure) and only herbaceous species from the lowest stratum.
Figure 3
Figure 3. Distribution of α-diversity-percentiles within grassland community plots across (a) all scale choices (18 species pools) and (b) all scale choices except the organismic scale choices with phylogenetic constraints (i.e. no species pool with only Asteraceae species to show the remaining effects after removing the most influential scale choice; 12 species pools remain).
Each boxplot shows the distribution of α-diversity-percentiles across the tested scale choices. Outliers are not plotted. Community plots are ranked according to the median position of their observed α-diversity-percentiles.
Figure 4
Figure 4. Distribution of α-diversity-percentiles within scale choices across grassland community plots.
Each dot in a violin plot represents one of the focal community plots; black dots identify community plots with significant high or low α-diversity-percentiles, small numbers below (and above) the violin plots give the percentage of community plots with significant patterns of clustering (or over-dispersion). The width of each violin plot refers to the density of data points. The enlarged triangle, diamond and square help to visualize the magnitude of change. Each of these identifies one community across different scale choices. Organismic scale constraints on the x-axis include phylogenetic constraints (all versus only Asteraceae family), growth form constraints (all versus herbaceous species only) and vegetation stratum constraints (all versus only lowest stratum). Environmental and spatial extent constraints on the y-axis include reduced environmental extent (all grassland polygons) and reduced spatial extent (focal grassland polygon).
Figure 5
Figure 5. Visual presentation of the regression and partial regression analyses for grassland community plots with arrows representing the effect of explanatory variables on response variables and numbers representing adjusted R2 values of the respective models (see Appendix S9 for more details).
(a) includes all scale choices (accordingly 18 species pools) and (b) includes all scale choices besides the choices that only include Asteraceae species (no family-only scale choices to show remaining effects after removing the most influential scale choice; 12 species pools remain). Organismic scale constraints include phylogenetic constraints (all versus only Asteraceae family), growth form constraints (all versus herbaceous species only) and vegetation stratum constraints (all versus only the lowest stratum). Environmental and spatial constraints include land-cover types and spatial extent (see Table 1 for more details). In a first step, we studied the influence of scale choices on the species pool diversity (Q) and on the α-diversity-residuals (resid(Q~IDcom), i.e. residuals of the regression of observed α-diversity, Q, against community plot identity, IDcom). In a second step, we studied the influence of all variables on percentile-residuals [resid(perc~IDcom), i.e. residuals of the regression of α-diversity-percentiles against IDcom].
Figure 6
Figure 6. Spearman rank correlations between the median of all α-diversity-percentiles for a community plot (without the focal scale choices) and the α-diversity-percentiles under focal scale choices for grassland communities.

References

    1. Baraloto C, Hardy OJ, Paine CET, Dexter KG, Cruaud C, Dunning LT, Gonzalez MA, Molino JF, Sabatier D, Savolainen V, Chave J. Using functional traits and phylogenetic trees to examine the assembly of tropical tree communities. Journal of Ecology. 2012;100:690–701.
    1. Bertness MD, Callaway R. Positive interactions in communities. Trends in Ecology and Evolution. 1994;9:191–193. - PubMed
    1. Blomberg SP, Garland T. Tempo and mode in evolution: phylogenetic inertia, adaptation and comparative methods. Journal of Evolutionary Biology. 2002;15:899–910.
    1. Cavender-Bares J, Keen A, Miles B. Phylogenetic structure of Floridian plant communities depends on taxonomic and spatial scale. Ecology. 2006;87:S109–S122. - PubMed
    1. Chalmandrier L, Münkemüller T, Gallien L, De Bello F, Mazel F, Lavergne S, Thuiller W. A family of null models to distinguish between habitat filtering and biotic interactions in functional diversity patterns. Journal of Vegetation Science. 2013;24:853–864. - PMC - PubMed

LinkOut - more resources