. 2014 Apr 29:4:8.
doi: 10.1186/2190-8567-4-8. eCollection 2014.

Effects of synaptic plasticity on phase and period locking in a network of two oscillatory neurons

Affiliations

Effects of synaptic plasticity on phase and period locking in a network of two oscillatory neurons

Zeynep Akcay et al. J Math Neurosci. .

Abstract

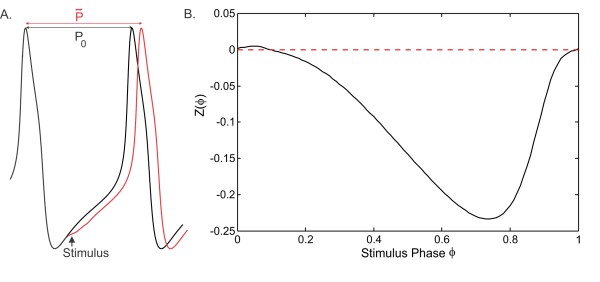
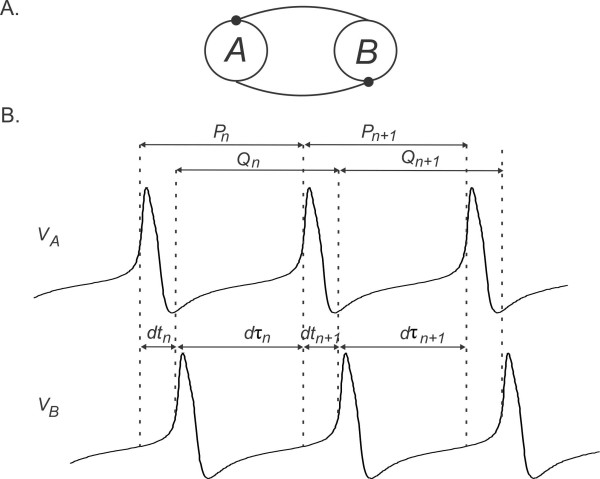
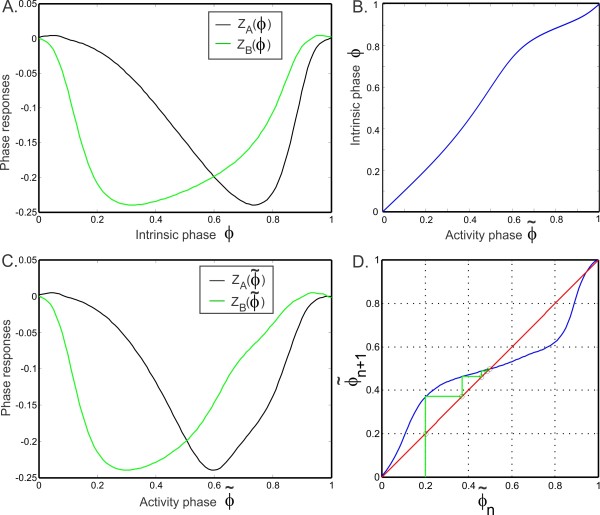
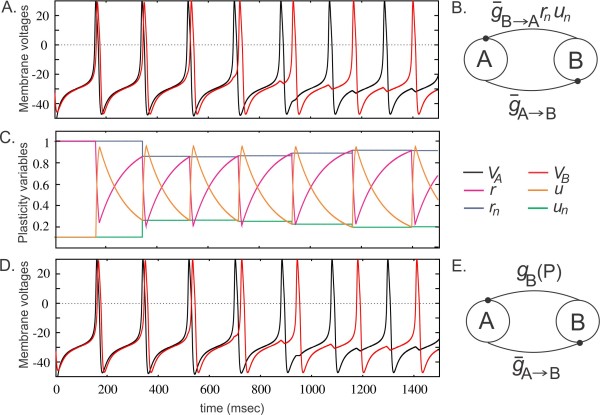
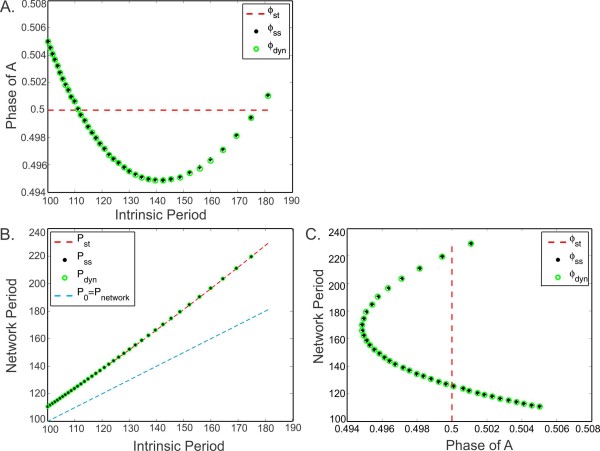
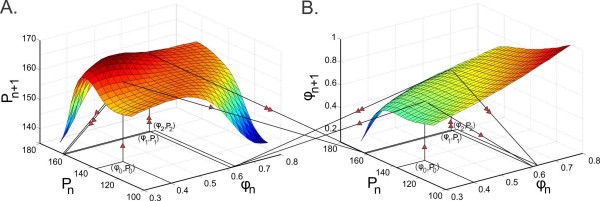
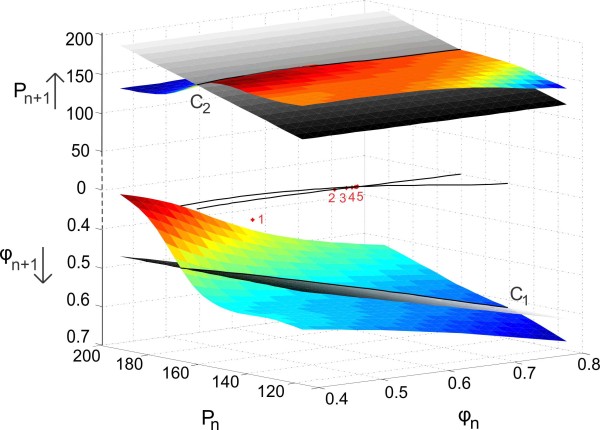
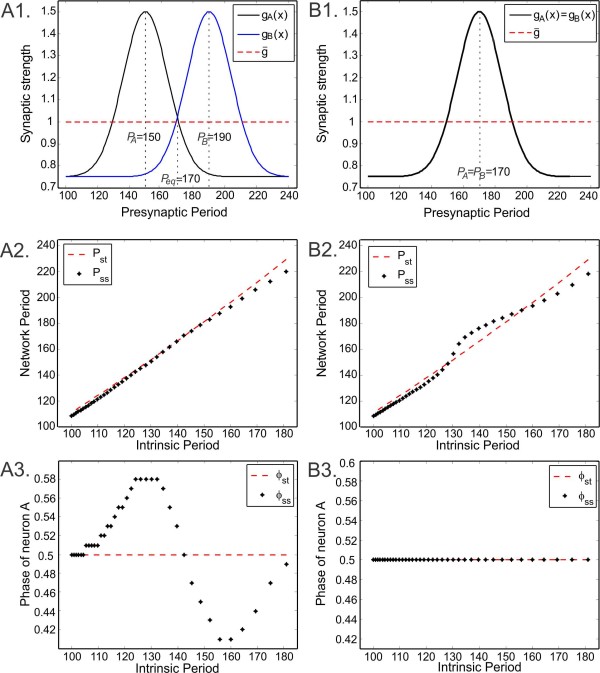
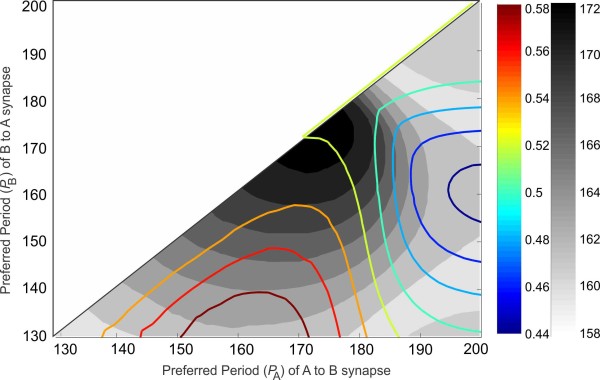
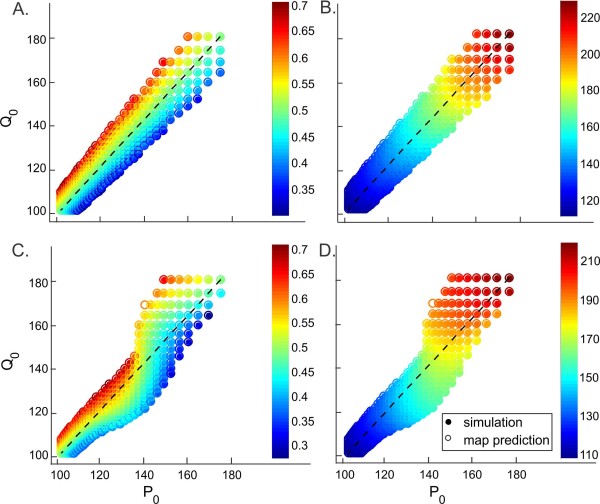
We study the effects of synaptic plasticity on the determination of firing period and relative phases in a network of two oscillatory neurons coupled with reciprocal inhibition. We combine the phase response curves of the neurons with the short-term synaptic plasticity properties of the synapses to define Poincaré maps for the activity of an oscillatory network. Fixed points of these maps correspond to the phase-locked modes of the network. These maps allow us to analyze the dependence of the resulting network activity on the properties of network components. Using a combination of analysis and simulations, we show how various parameters of the model affect the existence and stability of phase-locked solutions. We find conditions on the synaptic plasticity profiles and the phase response curves of the neurons for the network to be able to maintain a constant firing period, while varying the phase of locking between the neurons or vice versa. A generalization to cobwebbing for two-dimensional maps is also discussed.

Keywords: Oscillatory neural network; Phase locking; Phase response curve; Short-term synaptic plasticity.


Figures

Fig. 1
Fig. 1
PRC due to synaptic input. a A brief perturbing current pulse stimulus (arrow) is used to measure the PRC as described in Eq. (2.2). b The PRC obtained from the Morris–Lecar model (2.1) neurons by inhibitory synaptic input. The parameters are Iapp=42.2, synaptic conductance gprepost=0.1 and synaptic duration ta=14.3
Fig. 2
Fig. 2
Steady-state values of plasticity variables. The maximum value rmax that the depression variable r and the minimum value umin that the facilitation variable u reach at the steady state at the onset of presynaptic activity plotted against the presynaptic period. The plasticity profile of the synapse is given by their product
Fig. 3
Fig. 3
Schematic diagram of the coupled network and the map variables. a Schematic of the network connectivity diagram. b The cycle length Pn of cell A in cycle n (measured for the M–L simulations when voltage crosses Vth) can be divided into the delay between cell A activity to cell B activity (dtn) and the opposite (dτn). The cycle period Qn of cell B in cycle n is dτn+dtn+1
Fig. 4
Fig. 4
Phase locking for static synapses. a The left and right hand sides of the fixed point equation (3.11) for two identical neurons. The left hand side (black) is the response of neuron A and the right hand side is the response of neuron B at steady state. The intersection gives the fixed point. Note that the black curve is the PRC of both neurons. b The relation f1 between the intrinsic phase ϕ (3.2a) and the activity phase ϕ˜ (3.1a). c The same graph as panel a plotted as functions of the activity phase ϕ˜ using the transformation from ϕ to ϕ˜ shown in panel b. d Convergence of the iterates starting with the initial condition ϕ˜0=0.2 is shown in a cobweb diagram. The iterates (in green) converge to the fixed point at the intersection of the graph of ϕ˜n+1=Π(ϕ˜n) with the line ϕ˜n=ϕ˜n+1
Fig. 5
Fig. 5
Two-cell network with synaptic plasticity in one synapse. a Voltage traces obtained from simulations of the M–L neurons when the A to B synapse is of fixed strength and B to A synapse changes according to the plasticity model (2.3). c The evolution of the plasticity variables r, u, rn, and un according to the activity of neuron B. d Voltage traces obtained from simulations of the M–L neurons when the A to B synapse is of fixed strength and B to A synapse changes according to the steady-state plasticity profiles given by (2.4). b &e Network connectivity diagram corresponding to the simulations shown in a &d. The parameter values for the plasticity variables are τ1=2, τ2=190, τ3=2, τ4=190
Fig. 6
Fig. 6
A comparison of the 1D (3.7), 2D (3.21) and 3D (3.16) maps. a The steady-state phase of the neuron A, ϕst from map (3.7), ϕdyn from map (3.16), ϕss from map (3.21), shown as a function of the intrinsic period of both neurons (changed simultaneously). b The network period as a function of intrinsic periods corresponding to the same maps. c The relation between the network period and the phase of A for the same maps. The phase of A reaches a minimum at the network period equal to the preferred period of neuron B. The results of the two maps with plasticity ((3.14) and (3.19)) overlap in all panels
Fig. 7
Fig. 7
Cobwebbing diagram of the 2D map (3.24) for two identical cells (P0=Q0) and distinct synaptic plasticity profiles (PA=150, PB=190) shown in two coordinate systems. The period P1 and the intrinsic phase ϕ1 of neuron A in cycle 1 is obtained by evaluating the initial condition (ϕ0,P0) on the period surface Pn+1=Π2(ϕn,Pn) (a) and the phase surface ϕn+1=Π1(ϕn,Pn) (b). The point (ϕ1,P1) is then projected back to the xyaxis in both coordinate systems and mapped to the point (ϕ2,P2) with the same procedure. Lines with one arrow correspond to the first and lines with two arrows correspond to the second iteration
Fig. 8
Fig. 8
Fixed points of 2D (3.24) map when P0=Q0 obtained by solving (3.26). The surfaces for the evolution of period and intrinsic phase of the 2D map with synaptic preferred periods PA=150, PB=190 are drawn above and below the z=0 plane denoted by the axes z1=Pn+1 and z2=ϕn+1, respectively. The equality Pn=Pn+1 is satisfied when the surface z1=Π2(x,y) (colored surface on top) and the plane z1=y (gray-scaled plane on top) intersect. Similarly, the equality ϕn=ϕn+1 is satisfied when the surface z2=Π1(x,y) (colored surface on bottom) intersects the plane z2=x (gray-scaled plane on bottom). These intersections yield the two black curves above and below the z=0 plane. The fixed point of the map lies on the intersection of the two fixed point curves. The projections of these curves on the z=0 plane are shown together with the iterates (red dots) approaching the fixed point at their intersection in the order enumerated in the figure
Fig. 9
Fig. 9
Period and phase locking when both synapses follow the synaptic plasticity profile. Dashed line in all panels shows the case with two static synapses. a1 Synaptic plasticity profiles of the two synapses chosen to have different preferred periods at 150 and 190. a2 Network period as a function of the intrinsic periods. a3 Phase ϕ˜ of neuron A with respect to B as a function of intrinsic period. b1b3 Same as a1a3 but with identical synaptic plasticity profiles (preferred period at 170)
Fig. 10
Fig. 10
Period and phase locking for different steady-state synaptic plasticity profiles. The steady-state network period (gray) and phase (colored) are shown as a function of different steady-state synaptic plasticity profiles. Colored curves correspond to level sets of the phase. The edges of the gray bands correspond to the level sets of the network period. The plasticity profile of each synapse is marked by its preferred period
Fig. 11
Fig. 11
Coupling of non-identical M–L neurons. The phase of neuron A (a and c) and the period of the network (b and d) for coupled neurons with different intrinsic periods are shown for static synapses (a and b; g¯=0.1) and when the network follows the synaptic plasticity profile (c and d; PA=150, PB=190). The axes are the intrinsic periods of the two neurons. Plasticity adds nonlinearity to the period and phase distribution. Filled circles denote simulation results whereas open circles denote the map predictions. The map yields predictions very close to the simulations in most cases

References

    1. Wang S, Chandrasekaran L, Fernandez FR, White JA, Canavier CC. Short conduction delays cause inhibition rather than excitation to favor synchrony in hybrid neuronal networks of the entorhinal cortex. PLoS Comput Biol. 2012;4(1) Article ID e1002306. - PMC - PubMed
    1. Sieling FH, Archila S, Hooper R, Canavier CC, Prinz AA. Phase response theory extended to nonoscillatory network components. Phys Rev E, Stat Nonlinear Soft Matter Phys. 2012;4(5-2) Article ID 056208. - PMC - PubMed
    1. Oprisan SA, Prinz AA, Canavier CC. Phase resetting and phase locking in hybrid circuits of one model and one biological neuron. Biophys J. 2004;4(4):2283–2298. doi: 10.1529/biophysj.104.046193. - DOI - PMC - PubMed
    1. Maran SK, Canavier CC. Using phase resetting to predict 1:1 and 2:2 locking in two neuron networks in which firing order is not always preserved. J Comput Neurosci. 2008;4(1):37–55. doi: 10.1007/s10827-007-0040-z. - DOI - PMC - PubMed
    1. Cui J, Canavier CC, Butera RJ. Functional phase response curves: a method for understanding synchronization of adapting neurons. J Neurophysiol. 2009;4(1):387–398. doi: 10.1152/jn.00037.2009. - DOI - PMC - PubMed

LinkOut - more resources