. 2014 May 1;14(5):575-91.
doi: 10.1016/j.stem.2014.02.013.

INO80 facilitates pluripotency gene activation in embryonic stem cell self-renewal, reprogramming, and blastocyst development

Affiliations

INO80 facilitates pluripotency gene activation in embryonic stem cell self-renewal, reprogramming, and blastocyst development

Li Wang et al. Cell Stem Cell. .

Abstract

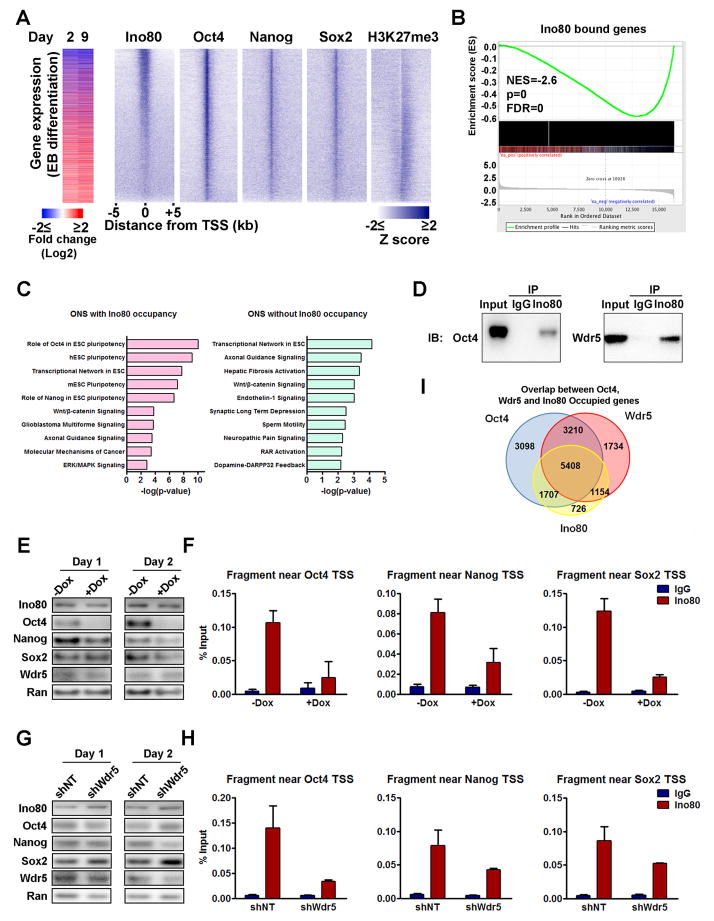
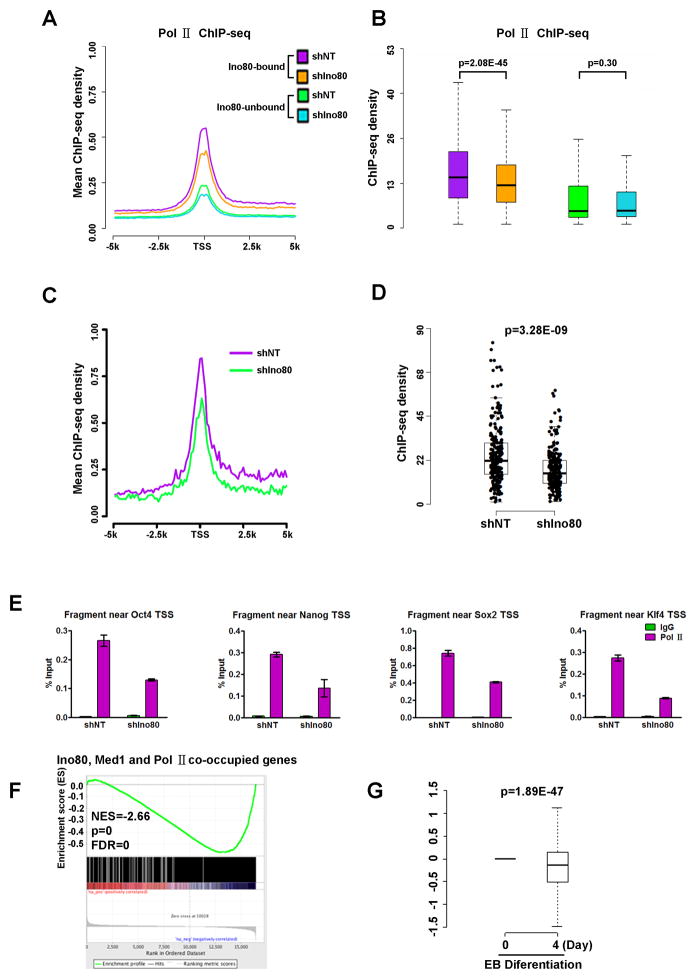
The master transcription factors play integral roles in the pluripotency transcription circuitry of embryonic stem cells (ESCs). How they selectively activate expression of the pluripotency network while simultaneously repressing genes involved in differentiation is not fully understood. Here, we define a requirement for the INO80 complex, a SWI/SNF family chromatin remodeler, in ESC self-renewal, somatic cell reprogramming, and blastocyst development. We show that Ino80, the chromatin remodeling ATPase, co-occupies pluripotency gene promoters with the master transcription factors, and its occupancy is dependent on OCT4 and WDR5. At the pluripotency genes, Ino80 maintains an open chromatin architecture and licenses recruitment of Mediator and RNA polymerase II for gene activation. Our data reveal an essential role for INO80 in the expression of the pluripotency network and illustrate the coordination among chromatin remodeler, transcription factor, and histone-modifying enzyme in the regulation of the pluripotent state.


Figures

Figure 1
Figure 1. INO80 is Required for ESC Self-renewal
(A) The Oct4GiP reporter assay after silencing different INO80 subunits. NT: non-targeting siRNA as negative control. % Differentiation was plotted as mean ± SEM. (B) ESC morphology after silencing INO80 subunits. (C–D) Pluripotency gene and lineage marker expression 96 hrs after Ino80 KD. Values were plotted as mean ± SEM (E) Ino80 expression during ESC differentiation induced by LIF-withdrawal, retinoic acid (RA) treatment, or embryoid body (EB) formation. Expression was normalized to day-0 by β-actin and plotted as mean ± SEM. (F) Oct4, Nanog, Sox2, Klf4 and Esrrb occupancy near the Ino80 gene locus based on published datasets. (G) Ino80 expression 48 hrs after Oct4 or Sox2 silencing. Expression was normalized to NT and plotted as mean ± SEM.
Figure 2
Figure 2. INO80 is Required for Key Pluripotency Gene Expression
(A) Venn diagram showing gene expression changes 96 hrs after INO80 subunits KD. Blue arrows: genes up- or down-regulated by Ino80, Ino80b, Ino80c and Ino80e silencing; red arrows: genes inconsistently affected by Ino80, Ino80b, Ino80c or Ino80e silencing. (B) Gene expression changes upon shRNA-mediated Ino80 silencing at the indicated time points. Selected pluripotency genes that are significantly down-regulated in at least 2 time points are listed. (C) GSEA showing that the Ino80 KD down-regulated genes were enriched for genes down-regulated during ESC differentiation into EBs. (D) Hierarchical clustering of pluripotency factors based on the gene expression changes caused by their KD. See methods for detailed description on GSEA and the hierarchical clustering analysis. (E) Ino80 peak distribution in the genome. (F) Average ChIP-seq read density of Ino80 and other factors near Ino80 peak center. Oct4, Nanog, Sox2, H3K4me3, H3K27ac, and H3K27me3 occupancy was based on published data. (G) Genome browser tracks to show Ino80 occupancy near Oct4, Nanog, Sox2, Klf4, Esrrb. Black bars indicate the regions (1 and 2) selected for ChIP-qPCR verification. (H) Venn diagram showing the overlap between genes differentially expressed after Ino80 KD and those occupied by Ino80. (I) IPA of the 678 Ino80 target genes. Selected top categories were shown and see Table S4 for the complete list of enriched categories.
Figure 3
Figure 3. Ino80 Occupies Genomic Regions Near Pluripotency Genes
(A) Factor occupancy near genes that are expressed during ESC differentiation. Left: Heat map showing gene expression fold-changes during EB formation at day-2 and day-9; Right: Heat maps showing Ino80, Oct4, Nanog, Sox2, and H3K27me3 occupancy. Genes are sorted based on Ino80 occupancy. EB differentiation, Oct4, Nanog, Sox2, and H3K27me3 ChIP-seq data were downloaded from the GEO database. (B) GSEA for genes associated with Ino80 occupancy. (C) Ingenuity analysis of genes co-occupied by Ino80 and the master transcription factors (ONS) and those co-occupied by the master transcription factors but not Ino80. (D) Interaction between Ino80 and Oct4, Wdr5. ESC lysates were sonicated and incubated with IgG or Ino80 antibody in the presence of Benzonase to remove nucleic acid contamination, and the presence of Oct4 and Wdr5 in the co-purified proteins were detected by western blot. (E) Western blot showing Oct4 depletion in ZHBTc4 cells at 24 and 48 hrs after Dox treatment. (F) Impact of Oct4 depletion on Ino80 occupancy at Oct4, Nanog, Sox2 promoter regions. ZHBTc4 cells were treated with Dox for 48 hrs to induce Oct4 depletion, and Ino80 occupancy was determined by ChIP-qPCRs. (G) Western blot showing Wdr5 depletion at 24 and 48 hrs after Wdr5 shRNA lentivirus transduction. (H) Impact of Wdr5 depletion on Ino80 occupancy. ESCs were transduced with Wdr5 shRNA lentivirus, and Ino80 occupancy was determined by ChIP-qPCRs 48 hrs after transduction. (I) Overlap between genes occupied by Ino80, Oct4, or Wdr5. Oct4 and Wdr5 occupancy was based on published data.
Figure 4
Figure 4. INO80 Promotes Mediator Recruitment at Pluripotency Gene Promoters
(A–B) Oct4, Klf4, and Med1 occupancy near TSS at Ino80-bound and Ino80-unbound genes. Oct4, Klf4, and Med1 occupancy was based on published data. (A) Average ChIP-seq read density. (B) Box plot of ChIP-seq read density. (C–H) Impact of Ino80 silencing on factor occupancy. ESCs were transduced with NT- (non-targeting) or Ino80-shRNA virus (shIno80), and factor occupancy was determined by ChIP-Seq or ChIP-qPCR 48 hrs after transduction. (C) Average ChIP-seq read density of Oct4, Klf4, and Med1 near TSS at Ino80-bound and Ino80-unbound genes in NT- or Ino80-shRNA virus transduced ESCs. (D) Box plot of Oct4, Klf4, and Med1 ChIP-seq read density near TSS. p-values were calculated between Ino80-bound and Ino80-unbound genes by Wilcoxon Rank-Sum test. (E) Average ChIP-seq read density of Med1 near TSS at Ino80-KD down-regulated genes. p-values were calculated by Wilcoxon Rank-Sum test. (F) Box plot of Med1 ChIP-seq read density near TSS at Ino80-KD down-regulated genes. p-values were calculated by Wilcoxon Rank-sum test. (G) Genome browser tracks to show Med1 occupancy near Oct4, Nanog, Sox2, and Klf4 in NT-or Ino80-shRNA virus transduced ESCs. Ino80 occupancy in ESCs was shown for comparison. (H) ChIP-qPCR to show Med1 occupancy near Oct4, Nanog, Sox2, and Klf4 TSS.
Figure 5
Figure 5. INO80 Promotes Pol II Recruitment at Pluripotency Gene Promoters
(A–E) Impact of Ino80 silencing on Pol II occupancy. ESCs were transduced with NT-(non-targeting) or Ino80-shRNA virus (shIno80), and Pol II occupancy was determined by ChIP-Seq or ChIP-qPCR 48 hrs after transduction. (A) Average ChIP-seq read density of Pol II near TSS at Ino80-bound and Ino80-unbound genes. p-values were calculated between Ino80-bound and Ino80-unbound genes by Wilcoxon Rank-Sum test. (B) Box plot of Pol II ChIP-seq read density near TSS at Ino80-bound and Ino80-unbound genes. p-values were calculated by Wilcoxon Rank-Sum test. (C) Average ChIP-seq read density of Pol II near TSS at Ino80-KD down-regulated genes. p-values were calculated by Wilcoxon Rank-Sum test. (D) Box plot of Pol II ChIP-seq read density near TSS at Ino80-KD down-regulated genes. p-values were calculated by Wilcoxon Rank-sum test. (E) ChIP-qPCR to show Pol II occupancy near Oct4, Nanog, Sox2, and Klf4 TSS. (F) GSEA for genes co-occupied by Ino80, Med1, and Pol II during ESC differentiation into EBs. (G) Expression of Ino80, Med1, and Pol II co-occupied genes during ESC differentiation into EBs. EB differentiation, Med1, Pol II ChIP-seq datasets were downloaded from the GEO database.
Figure 6
Figure 6. INO80 Maintains an Open Chromatin Structure
(A) ESCs were transduced with non-targeting (NT-) or Ino80-shRNA viruses and nucleosome occupancy was determined 48 hrs after transduction by MNase-qPCR. Relative occupancy was normalized to input and plotted as mean ± SEM. (B) Nucleosome occupancies (based on published data) around Ino80 (red) or Oct4 (blue) peak center in ESCs. (C) DNase I sensitivity assay. ESCs were transduced with non-targeting (NT) or Ino80-shRNA lentivirus. 48 hrs after transduction, cell nuclei were isolated and treated with the indicated amount of DNase I. The amount of uncut DNA fragments near the promoter regions of Ino80-bound (top panel) and unbound genes (bottom panel) was determined by qPCRs. Data were plotted as mean ± SEM. (D) Ino80 and DNase I occupancy (based on published data) around Ino80 peaks. Peaks are sorted based on Ino80 occupancy. (E) Left: Average DNase I hypersensitivity ChIP-seq read density at Ino80-occupied (red) or non-occupied (blue) regions near TSS. Right: Box plot of the average DNase I read density. (F) Activity of DNA fragments bound (Oct4 and Esrrb) or unbound (Gfi1b and Oprd1) by Ino80 in the luciferase reporter assay. Values were normalized to the vector alone (pGL3-04) and plotted as mean ± SEM. (G) Activity of DNA fragments bound or unbound by Ino80 in NT- or Ino80- shRNA transduced ESCs 48 hrs after transduction. Values were normalized to NT and plotted as mean ± SEM.
Figure 7
Figure 7. INO80 is Required for Reprogramming and Blastocyst Formation
(A) Ino80 expression during somatic cell reprogramming based on RT-qPCR. Expression was normalized by β-actin and to day-0, and plotted as mean ± SEM. (B–E) Effect of Ino80 KD on reprogramming. (B) Number of AP-positive colonies formed after reprogramming were plotted as mean ± SEM. (C–D) Percentage of Oct4GFP-positive cells formed after reprogramming was determined by FACS and plotted as mean ± SEM. (E) Expression of early reprogramming markers in NT- or Ino80-shRNA transduced MEFs at day-6 of reprogramming. (F) Ino80 expression during early embryonic development in vivo based on RT-qPCR. Expression was normalized to 1-cell embryo and plotted as mean ± SEM. (G) Immunofluorescence staining of Ino80 (red) and Oct4 (green) in E3.5 blastocysts. Cell nuclei were counter stained with DAPI (blue). (H–I) Effect of Ino80 KD on blastocyst development. (H) Morphology of embryos 4 days after siRNA injection. (I) Percentage of normal embryosat each developmental stage. Values were normalized to 2-cell stage and plotted as mean ± SEM from three independent experiments. (J–K) Gene expression analysis upon Ino80 silencing determined by RT-qPCR in the injected embryos. Expression of normalized by β-actin and to NT siRNA injected embryos, and was plotted as mean ± SEM.

Similar articles

Cited by

References

    1. Ang YS, Tsai SY, Lee DF, Monk J, Su J, Ratnakumar K, Ding J, Ge Y, Darr H, Chang B, et al. Wdr5 mediates self-renewal and reprogramming via the embryonic stem cell core transcriptional network. Cell. 2011;145:183–197. - PMC - PubMed
    1. Ansari SA, Morse RH. Mechanisms of Mediator complex action in transcriptional activation. Cellular and molecular life sciences: CMLS. 2013;70:2743–2756. - PMC - PubMed
    1. Apostolou E, Ferrari F, Walsh RM, Bar-Nur O, Stadtfeld M, Cheloufi S, Stuart HT, Polo JM, Ohsumi TK, Borowsky ML, et al. Genome-wide chromatin interactions of the Nanog locus in pluripotency, differentiation, and reprogramming. Cell Stem Cell. 2013;12:699–712. - PMC - PubMed
    1. Boyer LA, Lee TI, Cole MF, Johnstone SE, Levine SS, Zucker JP, Guenther MG, Kumar RM, Murray HL, Jenner RG, et al. Core transcriptional regulatory circuitry in human embryonic stem cells. Cell. 2005;122:947–956. - PMC - PubMed
    1. Chen X, Xu H, Yuan P, Fang F, Huss M, Vega VB, Wong E, Orlov YL, Zhang W, Jiang J, et al. Integration of external signaling pathways with the core transcriptional network in embryonic stem cells. Cell. 2008;133:1106–1117. - PubMed

Publication types

MeSH terms

Associated data