. 2014 May 1;14(5):658-72.
doi: 10.1016/j.stem.2014.01.019.

Mouse spermatogenic stem cells continually interconvert between equipotent singly isolated and syncytial states

Affiliations

Mouse spermatogenic stem cells continually interconvert between equipotent singly isolated and syncytial states

Kenshiro Hara et al. Cell Stem Cell. .

Abstract

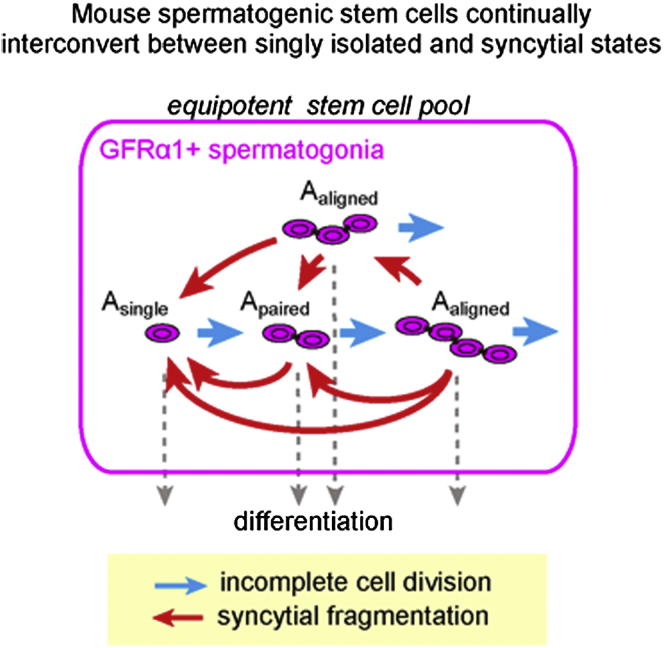
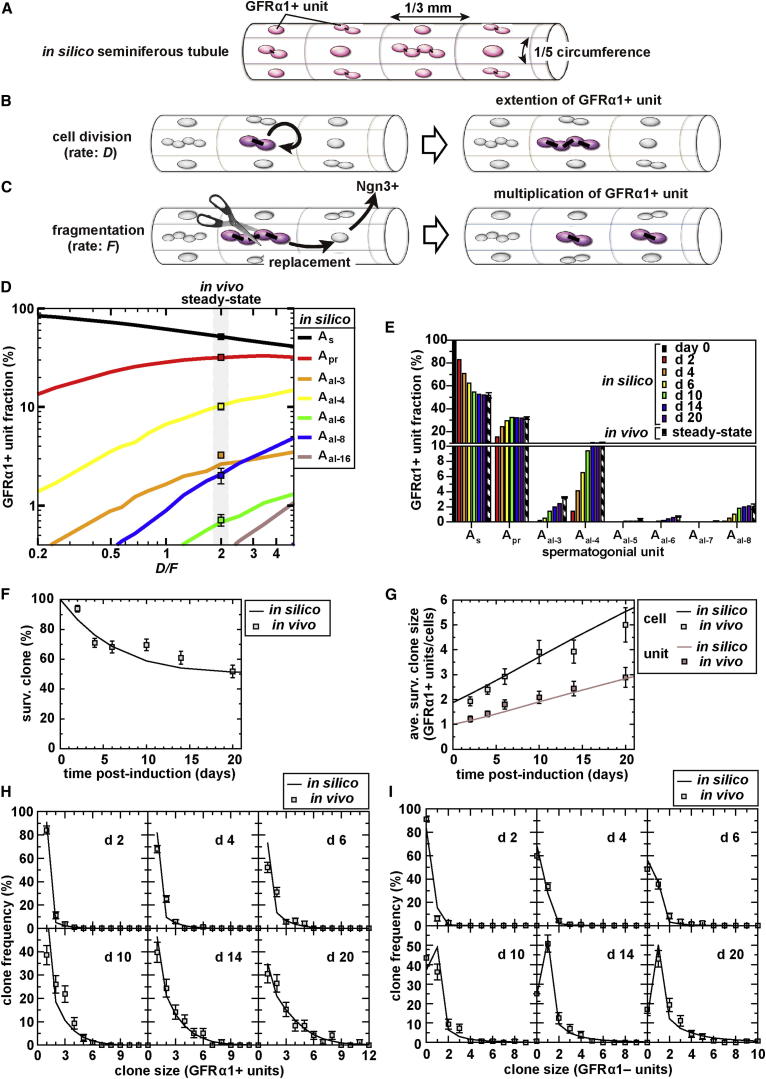
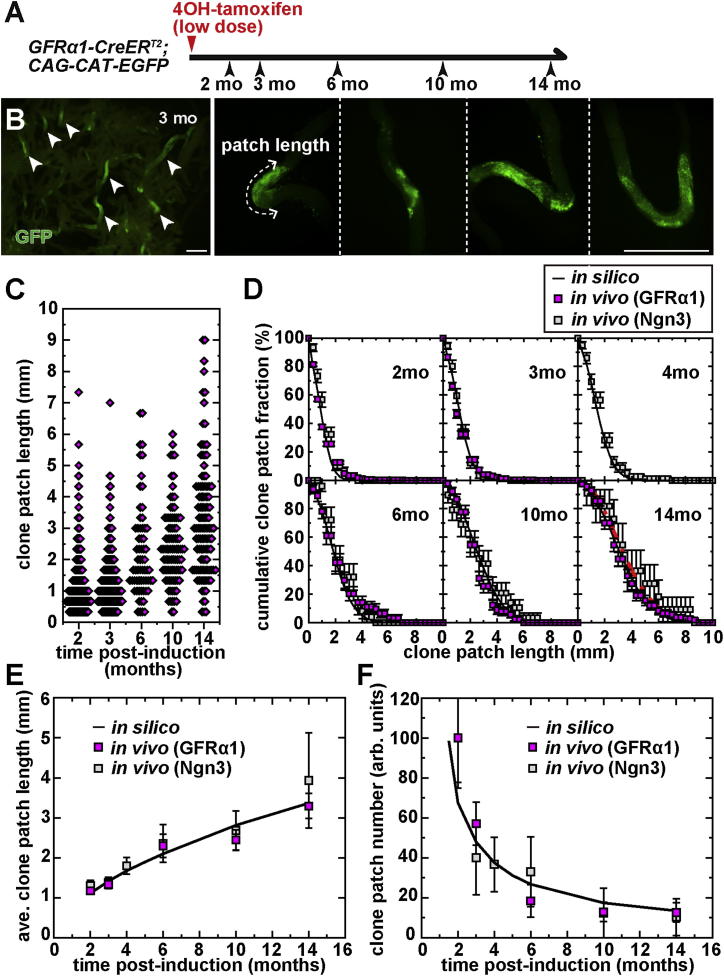
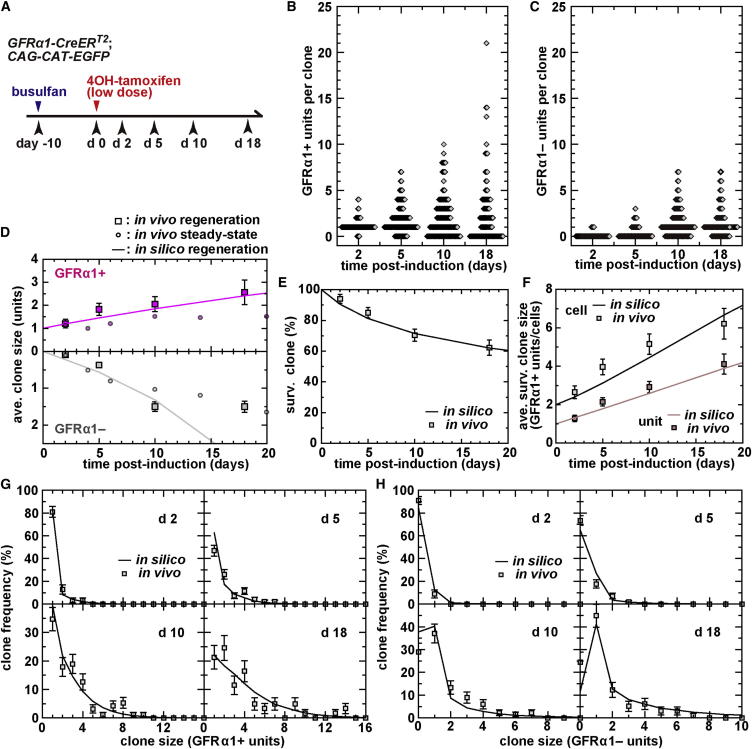
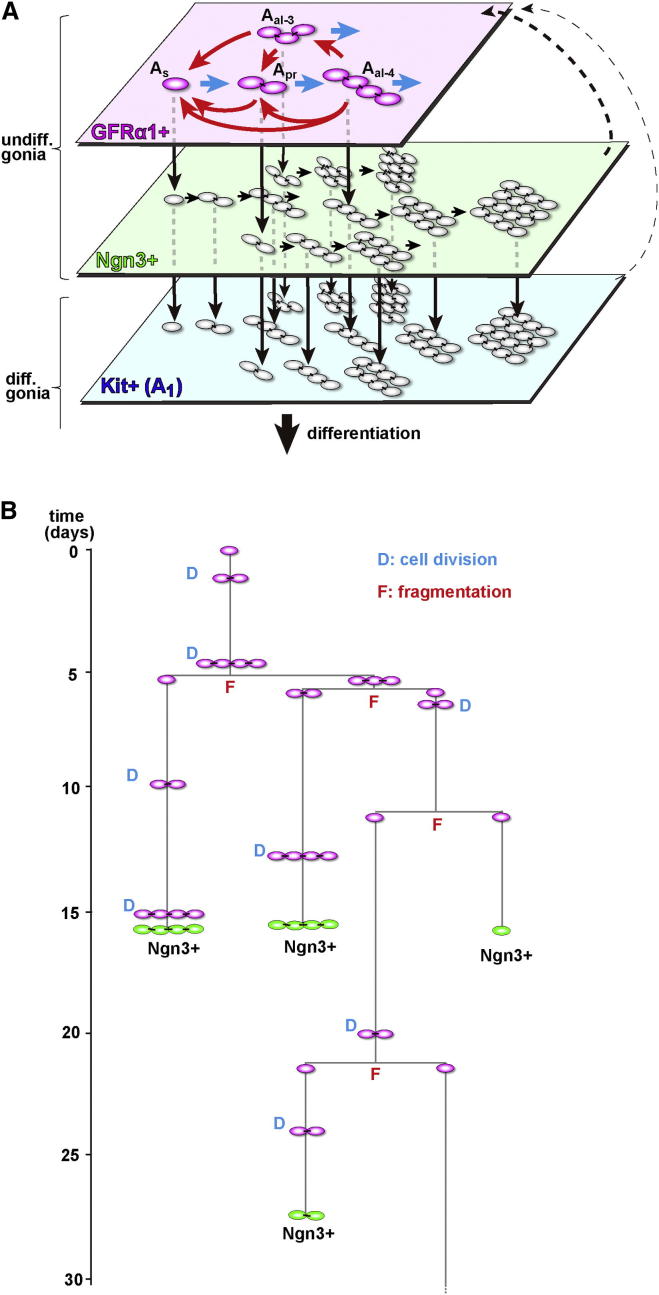
The identity and behavior of mouse spermatogenic stem cells have been a long-standing focus of interest. In the prevailing "As model," stem cell function is restricted to singly isolated (As) spermatogonia. By examining single-cell dynamics of GFRα1+ stem cells in vivo, we evaluate an alternative hypothesis that, through fragmentation, syncytial spermatogonia also contribute to stem cell function in homeostasis. We use live imaging and pulse labeling to quantitatively determine the fates of individual GFRα1+ cells and find that, during steady-state spermatogenesis, the entire GFRα1+ population comprises a single stem cell pool, in which cells continually interconvert between As and syncytial states. A minimal biophysical model, relying only on the rates of incomplete cell division and syncytial fragmentation, precisely predicts the stochastic fates of GFRα1+ cells during steady state and postinsult regeneration. Thus, our results define an alternative and dynamic model for spermatogenic stem cell function in the mouse testis.


Figures

None
Graphical abstract
Figure 1
Figure 1
GFRα1+ Spermatogonia in Mouse Seminiferous Tubules (A) Anatomy of seminiferous tubules. Undifferentiated spermatogonia (brown) and differentiating spermatogonia (blue) are distributed among Sertoli cells in the basal compartment (see text for details). (B) A proposed hierarchy of GFRα1+ and Ngn3+ subpopulations of undifferentiated spermatogonia, as well as Kit+ differentiating spermatogonia (modified from Nakagawa et al., 2010). Black and white solid arrows indicate processes that have been directly observed, whereas the black broken arrows represent presumptive dynamics of GFRα1+ cells, in which only GFRα1+ As self-renew (asterisk). Yellow broken arrows indicate the processes of “reversion,” which occur infrequently in steady state. (C) Immunofluorescence for GFRα1 in whole-mount seminiferous tubule specimen. Middle panel: distribution of GFRα1+ spermatogonia. Lower panels: higher magnification of GFRα1+ As, Apr, and Aal-4. Scale bars, 50 μm. (D) Composition of GFRα1+ spermatogonial units observed in adult mouse testis. Averages ± SEM from three testes are shown.
Figure 2
Figure 2
Pulse-Labeling Analyses of GFRα1+ Spermatogonia (A) Experimental schedule for (B)–(D). GFRα1-CreERT2; CAG-CAT-EGFP mice were administered with 2.0 mg 4OH-tamoxifen to pulse label GFRα1+ units with GFP, and their testes were analyzed at the indicated time points. (B) Labeling of a fraction of GFRα1+ cells (magenta) with GFP expression (green) 2 days after pulse. (C) Untangled seminiferous tubules at 365 days postlabeling, showing numerous patches of GFP+ cells (left) and a cross-section of such a patch in which GFP signal is found in all stages of germ cell differentiation (right). (D) Fraction of GFP+ cells out of total GFRα1+ population from 2 to 365 days postinduction. Averages ± SEM from 3, 4, 4, 3, 3, and 3 testes for 2, 10, 20, 40, 180, and 365 days postinduction are shown, respectively. (E) Experimental schedule for clonal fate analysis of pulse-labeled GFRα1+ units in (F)–(N). GFRα1-CreERT2; CAG-CAT-EGFP mice were administrated with 0.35 mg 4OH-tamoxifen to sparsely label the GFRα1+ spermatogonia at an efficiency of 1.0% ± 0.1% (n = 3) and analyzed at the indicated time points. (F–I) Whole-mount staining of seminiferous tubule for GFP (green) and GFRα1 (magenta) at 2 (F) and 14 (G, H, and I) days postinduction; stains are scored as shown below. Arrows indicate the labeled GFRα1+ units. (J and K) Distribution of clone size as measured by GFRα1+ (J) and GFRα1− (K) unit number per clone over time. Each dot indicates one clone. The clones shown in (F)–(I) are plotted as shown by white, magenta, green, and blue arrowheads, respectively. (L and M) Average number of GFRα1+ and GFRα1− units (L) and cells (M) over the total clones. In (M), syncytia of 32 or more cells, all of which were GFRα1− and observed 4 or more days after the pulse, were scored as 32-cell syncytia because of the difficulty in making a precise count; this method underestimates the number of GFRα1− cells (broken line). (N) Composition of the unit length of total pulse-labeled GFRα1+ spermatogonia over time, compared with steady-state tissue composition. Data in (L)–(N) show averages ± SEM (n = 3, 4, 5, 4, 4, 6, and 3 testes for 2, 4, 6, 10, 14, and 20 days postinduction, respectively). Scale bars, 50 μm throughout. The row data for (J)–(N) are shown in Table S1.
Figure 3
Figure 3
Dynamics of GFRα1+ Spermatogonia Observed by Live Imaging (A) Summary of cell division, fragmentation, and death of GFRα1+ spermatogonia observed in live imaging of GFRα1-EGFP knockin mouse testes. Average rates of each event are calculated as “counts of observed events”/“total observation time.” nd, not detected. (B–D) Examples of an As → 2 × As division (B), an As→Apr division (C), and an Apr→Aal-4 division, followed by a fragmentation into an As (red arrowhead) and an Aal-3 (D), shown in selected frames of Movies S1, S2, and S3, respectively. Arrowheads, GFRα1-GFP+ spermatogonia; numerals, elapsed time relative to the cell division (hr). Asterisks, blood vessels. (E and F) Localization and movement of GFRα1+ spermatogonia observed in live imaging. (E and E’) A representative image of the surface of GFRα1-EGFP mouse testis (the first frame of Movie S4) is shown. (E’) Trace of (E) showing GFRα1+ spermatogonia (magenta), blood vessels (red), and interstitium (yellow). (F) Trajectories of individual GFRα1-GFP+ spermatogonia over 48 hr of observation (Movie S4), shown in different colors. (G and H) Movement of GFRα1+ spermatogonia among the immobile Sertoli cells. (G) The first frame of the live imaging of GFRα1-EGFP; GATA1-EGFP mouse testis (Movie S5). (G′) Trace of (G) showing a GFRα1+ spermatogonium (magenta), Sertoli cells (brown), blood vessels (red), and interstitium (yellow). (H) Trajectories of a GFRα1-EGFP+ spermatogonium (black line) and GATA1-EGFP+ Sertoli cells (colored lines) during 21 hr of observation, overlaid on the first frame. Asterisks indicate the starting positions; scale bars, 30 μm.
Figure 4
Figure 4
Model Prediction of the In Vivo Dynamics of GFRα1+ Spermatogonia (A) An imaginary seminiferous tubule used as the framework for the modeling scheme: the basal compartment is modeled as a regular cylindrical lattice, in which each domain accommodates one GFRα1+ unit. (B and C) Elementary processes introduced into the model. With the rate of “D,” a GFRα1+ spermatogonial unit divides incompletely to double its length (B). With the rate of “F” per bridge, a GFRα1+ syncytium fragments into multiple pieces; this event is allied with the GFRα1+ → Ngn3+ transition of neighboring unit(s).. As a result, newly generated units replace neighboring units and persist as GFRα1+ (C). For details, see the main text and the Supplemental Experimental Procedures. (D) Dependence of the steady-state unit composition on the ratio D/F predicted in silico (multicolored lines), in which the rates measured from live imaging (D = once/10 days; F = once/20 days/bridge; D/F = 2.0) captured the in vivo steady-state composition obtained from whole-mount immunostaining (squares). (E) Convergence in silico to steady-state composition of GFRα1+ units from an initial condition in which all GFRα1+ units are As, using the rate constants D = once/10 days and F = once/20 days/bridge. (F–I) Model prediction captures clonal fate behaviors of GFRα1+ units observed in vivo over the 20 day time course, represented by a percentage of surviving clones out of total clones (F), average number of GFRα1+ units(cells) in individual surviving clones (G), and clone size distribution for GFRα1+ (H) and GFRα1− (I) units. Throughout, lines show the in silico predictions using the same D and F rates, whereas the experimental data are shown by squares (average ± SEM among testes). (H) and (I) are replotted from Figures 2J and 2K.
Figure 5
Figure 5
Long-Term Dynamics of GFRα1+ Spermatogonia-Derived Clones (A) Experimental schedule for the long-term clonal analysis of pulse-labeled GFRα1+ cells. (B) Seminiferous tubules at 3 months postlabeling, showing GFP+ clonal patches (arrowheads) and their higher magnifications with measurement of the patch length. Scale bars, 1 mm. (C) Distribution of clonal patch lengths at 2, 3, 6, 10, and 14 months postinduction. (D) Comparison of clonal patch length distribution between in silico prediction (solid lines) and in vivo measurement (squares) over 14 months. Red dotted line in the panel of 14 months shows the scaling function obtained by Klein et al., 2010. (E and F) Comparisons of the evolution of average patch length (E) and patch number per testis presented in arbitrary units (F) between in silico prediction (solid line) and in vivo measurements (squares). In (D), (E), and (F), magenta and gray squares indicate patches originated from GFRα1+ (replotted from C) and Ngn3+ units (replotted from Klein et al., 2010 and Nakagawa et al., 2007), respectively. Values are shown as average ± SEM.
Figure 6
Figure 6
Dynamics of GFRα1+ Spermatogonia during Regeneration (A) Experimental schedule for clonal analysis of GFRα1+ spermatogonia during regeneration. (B and C) Distribution of clone size over 18 days after induction scored by the number of GFRα1+ (B) and GFRα1− (C) units. (D–H) The observed in vivo clonal fate behavior of the pulse-labeled GFRα1+ units in regeneration (squares; shown as average ± SEM), and their recapitulation by in silico model prediction after fitting for the rates of D and F and death of GFRα1− units (solid lines; see main text): average numbers of GFRα1+ (upper) and GFRα1− (lower) units per clone compared with those in steady-state (small circles; reproduced from Figure 2L) (D), the percentage of surviving clones (E), the average number of GFRα1+ unit(cell) per clone (F), and the clone size distribution scored by the number of GFRα1+ (G) and GFRα1− units (H) (replotted from B and C, respectively).
Figure 7
Figure 7
A Proposed Stem Cell Dynamics of Mouse Spermatogenesis (A) A scheme of the proposed stem cell dynamics. On the top of the differentiation hierarchy, GFRα1+ spermatogonia comprise a single stem cell pool, in which cells continually and reversibly interconvert between states of As, Apr, and Aal spermatogonia through incomplete cell division (blue arrows) and syncytial fragmentation (red arrows), while giving rise to Ngn3+ cells. After leaving the GFRα1+ compartment, differentiation-destined cells follow a series of transition (GFRα1+→Ngn3+→Kit+; downward black arrows) that accompanies the extension of syncytial length (rightward black arrows). Ngn3+ and, to a lesser extent, Kit+ cells retain the capacity to revert into the GFRα1+ compartment in a context-dependent fashion (broken arrows). (B) Pedigree of a GFRα1+ unit-derived clone evolved in the in silico modeling scheme, representing a typical interconversion between As and syncytial states through incomplete cell division (D) and fragmentation (F), as well as generation of Ngn3+ spermatogonia.

References

    1. Barroca V., Lassalle B., Coureuil M., Louis J.P., Le Page F., Testart J., Allemand I., Riou L., Fouchet P. Mouse differentiating spermatogonia can generate germinal stem cells in vivo. Nat. Cell Biol. 2009;11:190–196. - PubMed
    1. Braun R.E., Behringer R.R., Peschon J.J., Brinster R.L., Palmiter R.D. Genetically haploid spermatids are phenotypically diploid. Nature. 1989;337:373–376. - PubMed
    1. Chiarini-Garcia H., Hornick J.R., Griswold M.D., Russell L.D. Distribution of type A spermatogonia in the mouse is not random. Biol. Reprod. 2001;65:1179–1185. - PubMed
    1. de Rooij D.G., Russell L.D. All you wanted to know about spermatogonia but were afraid to ask. J. Androl. 2000;21:776–798. - PubMed
    1. Erickson B.H. Survival and renewal of murine stem spermatogonia following 60Co gamma radiation. Radiat. Res. 1981;86:34–51. - PubMed

Publication types

MeSH terms

Substances