. 2014 Jul 1;90(1):73-87.
doi: 10.1016/j.bcp.2014.04.015. Epub 2014 Apr 30.

Tylvalosin exhibits anti-inflammatory property and attenuates acute lung injury in different models possibly through suppression of NF-κB activation

Affiliations

Tylvalosin exhibits anti-inflammatory property and attenuates acute lung injury in different models possibly through suppression of NF-κB activation

Zhanzhong Zhao et al. Biochem Pharmacol. .

Abstract

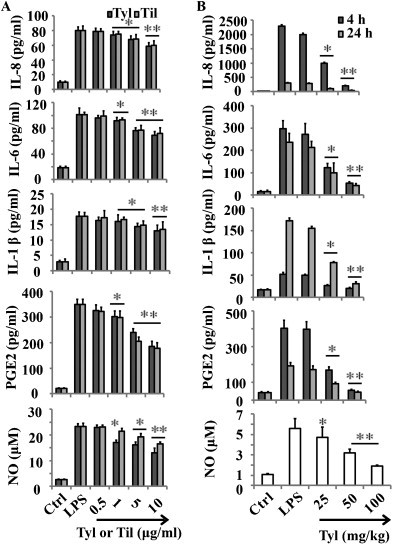
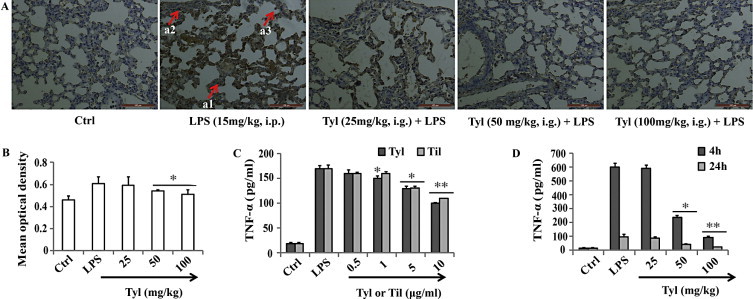
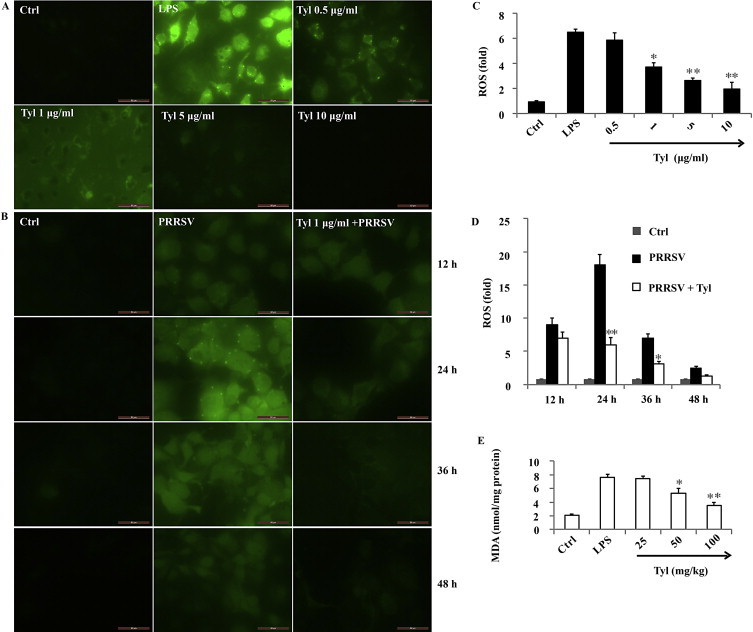
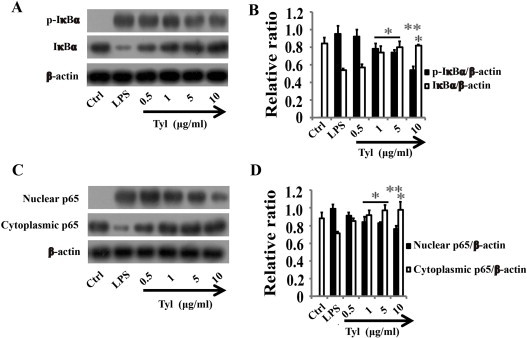
Tylvalosin, a new broad-spectrum, third-generation macrolides, may exert a variety of pharmacological activities. Here, we report on its anti-oxidative and anti-inflammatory activity in RAW 264.7 macrophages and mouse treated with lipopolysaccharide (LPS) as well as piglet challenged with porcine reproductive and respiratory syndrome virus (PRRSV). Tylvalosin treatment markedly decreased IL-8, IL-6, IL-1β, PGE2, TNF-α and NO levels in vitro and in vivo. LPS and PRRSV-induced reactive oxygen species (ROS) production, and the lipid peroxidation in mice lung tissues reduced after tylvalosin treatments. In mouse acute lung injury model induced by LPS, tylvalosin administration significantly attenuated tissues injury, and reduced the inflammatory cells recruitment and activation. The evaluated phospholipase A2 (PLA2) activity and the increased expressions of cPLA2-IVA, p-cPLA2-IVA and sPLA2-IVE were lowered by tylvalosin. Consistent with the mouse results, tylvalosin pretreatment attenuated piglet lung scores with improved growth performance and normal rectal temperature in piglet model induced by PRRSV. Furthermore, tylvalosin attenuated the IκBα phosphorylation and degradation, and blocked the NF-κB p65 translocation. These results indicate that in addition to its direct antimicrobial effect, tylvalosin exhibits anti-inflammatory property and attenuates acute lung injury through suppression of NF-κB activation.

Keywords: Acute lung injury; Anti-inflammation; NF-κB; Tylvalosin.


Figures

None
Graphical abstract
Fig. 1
Fig. 1
Chemical structure of tylosin, tylvalosin (Tyl), and tilmicosin (Til). In tyl, R1 is acetyl, and R2 is isovaleryl.
Fig. 2
Fig. 2
Tylvalosin suppresses LPS-induced proinflammatory cytokines production. (A) Effects of different concentrations of tylvalosin and tilmicosin on LPS-induced IL-8, IL-6, IL-1β, PGE2 and NO in LPS stimulated RAW 264.7 cells. The cells were treated with LPS alone or LPS plus different concentrations (0.5, 1, 5 and 10 μg/ml) of tylvalosin and tilmicosin for 18 h. (B) Effects of tylvalosin on the production of proinflammatory cytokines IL-8, IL-6, IL-1β, PGE2 and NO in the BALF. Mice were given tylvalosin (25, 50 and 100 mg/kg, i.g.) 2 h prior to administration of LPS. BALF was collected at 4 h and 24 h following LPS challenge to analyze the proinflammatory cytokines. The values represent mean ± SD of three independent experiments and differences between mean values were assessed by Student's t-test. *P < 0.05 vs LPS, **P < 0.01 vs LPS.
Fig. 3
Fig. 3
Tylvalosin suppresses TNF-α level. (A) Immunohistochemical localization of TNF-α in the lung. Immunohistochemical analyses for TNF-α show positive staining for TNF-α mainly localized in the epithelial bronchial cells (see arrows a1), in inflammatory cells in subbronchial epithelial (see arrows, a2), and in lymphocytes (a3). Figure is representative of at least three experiments performed on different experimental days. Original magnification 200×. (B) Quantitative immunohistochemical expression of TNF-α expression in lungs. The immunohistochemical images were analyzed quantitatively using Image Pro-Plus v6.0. Density means are expressed as mean ± SD. Quantitative analysis showed significantly decreased expression of TNF-α in lungs from mice treated with tylvalosin (50 and 100 mg/kg, i.g.). (C) Effects of different concentrations of tylvalosin and tilmicosin on LPS-induced TNF-α in LPS stimulated RAW 264.7 cells. The cells were treated with LPS alone or LPS plus different concentrations (0.5, 1, 5 and 10 μg/ml) of tylvalosin and tilmicosin for 18 h. (D) Effects of tylvalosin on the production of TNF-α in the BALF. Mice were given tylvalosin (25, 50 and 100 mg/kg, i.g.) 2 h prior to administration of LPS. BALF was collected at 4 h and 24 h following LPS challenge to analyze the proinflammatory cytokines. The values represent mean ± SD of three independent experiments and differences between mean values were assessed by Student's t-test. *P < 0.05 vs LPS, **P < 0.01 vs LPS.
Fig. 4
Fig. 4
Tylvalosin attenuates oxidative stress. (A) Representative photos from RAW264.7 cells treated with tylvalosin at indicated concentration and co-incubated with LPS (1 μg/ml) for 18 h. Cells were washed twice with PBS, and the intracellular levels of ROS were analyzed by fluorescence microscopy. (B) Representative photos from Marc-145 cells treated with tylvalosin (1 μg/ml) and co-incubated with PRRSV Jx (MOI =1) for 12, 24, 36 and 48 h, respectively. Cells were washed twice with PBS, and the intracellular levels of ROS were analyzed by fluorescence microscopy. (C) Effects of tylvalosin on the LPS-induced ROS generation in RAW264.7 cells. RAW264.7 cells (2 × 105 cells/well in 24-well culture plates; n = 6) were treated with tylvalosin at indicated concentration and co-incubated with LPS (1 μg/ml) for 18 h. DCFH2-DA (10 μM) was used to determine the generation of intracellular ROS. DCF fluorescence intensities were determined from the same numbers of cells in randomly selected areas. (D) Effects of tylvalosin on the LPS-induced ROS generation in RAW264.7 cells. RAW264.7 cells (2 × 105 cells/well in 24-well culture plates; n = 6) were treated with LPS (1 μg/ml) for 18 h with tylvalosin at indicated concentration and co-incubated with LPS (1 μg/ml). DCFH2-DA (10 μM) was used to determine the generation of intracellular ROS. DCF fluorescence intensities were determined from the same numbers of cells in randomly selected areas. (E) Effects of tylvalosin on the lung MDA levels. MDA level was significantly increased in LPS-treated mice compared with ctrl mice. This increase in MDA level was significantly reduced by posttreatment with tylvalosin (50 and 100 mg/kg, i.g.). The data are mean ± SD (n = 6). *P < 0.05 vs LPS group; **P < 0.01 vs LPS group. Original magnification 400×.
Fig. 5
Fig. 5
Tylvalosin ameliorates LPS-induced acute tissues injury and inflammation response in mice 4 h and 24 h after i.p. PBS or LPS. ((A) and (B)) Lung and liver histological examination 4 h after i.p. PBS or LPS demonstrated increased perivascular exudates (arrow), thickened alveolar septa (asterisk), airspace edema, apoptosis and necrosis in LPS treated mice when compared with tissues of tylvalosin (P< 0.01 for 50 and 100 mg/kg) treated mice. ((C) and (D)) Twenty-four hours after LPS injection, LPS mice continued to have more severe lung and liver injury than tylvalosin (**P < 0.01 for 50 and 100 mg/kg) treated mice. Original magnification 200×. (E) LPS treatment mice had more severe lung and liver injury histological scores at both 4 and 24 h, based on hemorrhage, interstitial edema, inflammatory cells infiltration and hepatocyte degeneration, apoptosis and necrosis. Total BALF protein concentration (F) and wet:dry ratio (G) were increased in LPS mice after i.p. LPS when compared with ctrl mice and tylvalosin treatment mice (n = 10 each group, replicated 3 times for histology, wet:dry, BALF protein, *P < 0.05, **P < 0.01; histological scores were from three mice per group, three lobes examined per mouse).
Fig. 6
Fig. 6
Tylvalosin suppresses LPS-induced inflammatory cells recruitment and activation. BALF was collected at 4 h and/or 24 h following LPS challenge to measure the number of total cells (Tcs) (A), macrophages (B), and neutrophils (C) based on the differential cell identification. MPO activity (D) in BALF at 24 h was determined with a kit by measurement of the H2O2-dependent oxidation of an odianisidine solution. The values presented are the mean ± SD (n = 6 in each group). *P < 0.05, **P < 0.01 vs LPS group. Superior lobe of right lung and liver were processed at 24 h following LPS challenge to analyze MPO expression with immunohistochemistry. Representative immunostaining (E) for myeloperoxidase (MPO) on lung and liver sections were presented. Alveolar epithelial cells (arrows) in close proximity to degranulated neutrophils stained positive for MPO. Endothelial cells (arrowheads) near intravascular undegranulated neutrophils stained negative for MPO. Scale bars = 100 μm. Figure is representative of at least three experiments performed on different experimental days. Original magnification 200×.
Fig. 7
Fig. 7
Tylvalosin inhibits PLA2 expression and activation. (A) iPLA2 VI, (B) cPLA2-IVA, (C) p-cPLA2-IVA and (D) sPLA2-IVE were analyzed by immunohistochemistry in sections of lungs from ctrl, LPS and LPS + tylvalosin (25, 50 and 100 mg/kg, i.g.) treatment mice. Representative photomicrographs of staining are shown with arrows. Immunohistochemical analyses for PLA2 show positive staining for PLA2 mainly localized in the epithelial bronchial cells (see arrows a1), in inflammatory cells in subbronchial epithelial (see arrows, a2), and in leukocytes (a3). Score analysis of positive cells, performed on Ctrl, LPS and LPS + tylvalosin (25, 50 and 100 mg/kg, i.g.) treatment mice. Strong immunostaining was observed in the epithelial bronchial cells (see arrows a1), in inflammatory cells in subbronchial epithelial (see arrows, a2), and in leukocytes (a3) from LPS-treated mice. The immunohistochemical images were analyzed quantitatively using Image Pro-Plus v6.0. Mean optical density (MOD) are expressed as mean ± SD. Original magnification 200×.
Fig. 8
Fig. 8
Tylvalosin inhibits PLA2 activity. PLA2 activity was measured in homogenates of lungs from ctrl mice and LPS-treated mice using the DBPC-based fluorometric method. Data are means ± SD from five analyses. Omission of the primary antibody or incubation with an irrelevant antibody showed no signal (not shown). *P < 0.05; **P < 0.01 vs LPS.
Fig. 9
Fig. 9
Tylvalosin attenuates PRRSV-induced clinical disease and improve growth. (A) The antiviral effect of tylvalosin on PRRSV isolations infection. Marc-145 cells were treated with 1 μg/ml tylvalosin for 4 h, and then infected with PRRSV isolations. At 20 h post-infection, virus was harvested and titers were determined. The values of Log TCID50 reduction shown here are the mean ± SD of three independent experiments. (B) Rectal temperatures were monitored daily for pigs in the groups 1, 2, 3 and 4 (n = 5). Temperature above 40 °C was considered febrile. Data represented as mean ± SD. (C) Growth effects of tylvalosin on swine. All experimental pigs were weighed at Days 1, 28 and end of study. The average daily weight gain (ADWG) from five pigs in each group was calculated at period of 1 to 28 and 28–49 dpi. Data represented as mean ± SD. (D) Tylvalosin medication on the effect of lung lesion scores. Animals were sacrificed at 21 dpi when lungs were scored for gross pathology. Gross pathology data represented mean ± SD. Significance is indicated by: *P < 0.05, **P < 0.01.
Fig. 10
Fig. 10
Tylvalosin suppresses LPS-induced IκBα phosphorylation and degradation, and NF-κB p65 translocation in RAW264.7 cells. RAW 264.7 cells were treated in the presence of either LPS (1 μg/ml) alone, or LPS plus tylvalosin (0.5, 1, 5 and 10 μg/ml). Protein samples were analyzed by western blot with special antibodies. Quantification of protein expression was normalized to β-actin using NIH ImageJ v1.46. The data are representative of three independent experiments and expressed as mean ± SD. *P < 0.05 vs LPS, **P < 0.01 vs LPS.
Fig. 11
Fig. 11
Tylvalosin suppresses LPS-induced IκBα phosphorylation and degradation in the lung tissues. ((A) and (B)) Representative immunohistochemistry for p-IκBα and IκBα of lung tissue sections from normal control, LPS and LPS + tylvalosin (25, 50, 100 mg/kg). Dark brown staining indicates p-IκBα and IκBα, blue/purple staining indicates cell nuclei. Short arrows point out alveolar epithelial type II cells, alveolar macrophages are designated by the longer arrow. The immunohistochemical images were analyzed quantitatively using Image Pro-Plus v6.0. Density means are expressed as mean ± SD. Quantitative analysis showed significantly decreased expression of p-IκBα and increased expression of IκBα in lungs after mice treated with tylvalosin (50 and 100 mg/kg, i.g.). The level of significance was set at *P < 0.05, **P < 0.01. Original magnification: 200×.

References

    1. Martin T.R., Wurfel M.M. A TRIFfic perspective on acute lung injury. Cell. 2008;133(2):208–210. - PMC - PubMed
    1. Imai Y., Kuba K., Neely G.G., Yaghubian-Malhami R., Perkmann T., van Loo G. Identification of oxidative stress and Toll-like receptor 4 signaling as a key pathway of acute lung injury. Cell. 2008;133:235–249. - PMC - PubMed
    1. Ware L.B., Matthay M.A. The acute respiratory distress syndrome. N Engl J Med. 2000;342:1334–1349. - PubMed
    1. Rubenfeld G.D., Caldwell E., Peabody E., Weaver J., Martin D.P., Neff M. Incidence and outcomes of acute lung injury. N Engl J Med. 2005;353(16):1685–1693. - PubMed
    1. Hayes M., Curley G., Ansari B., Laffey J.G. Clinical review: stem cell therapies for acute lung injury/acute respiratory distress syndrome—hope or hype? Crit Care. 2012;16:205. - PMC - PubMed

Publication types

MeSH terms