. 2014 May 15;40(5):681-91.
doi: 10.1016/j.immuni.2014.04.006. Epub 2014 May 1.

Downmodulation of tumor suppressor p53 by T cell receptor signaling is critical for antigen-specific CD4(+) T cell responses

Affiliations

Downmodulation of tumor suppressor p53 by T cell receptor signaling is critical for antigen-specific CD4(+) T cell responses

Masashi Watanabe et al. Immunity. .

Abstract

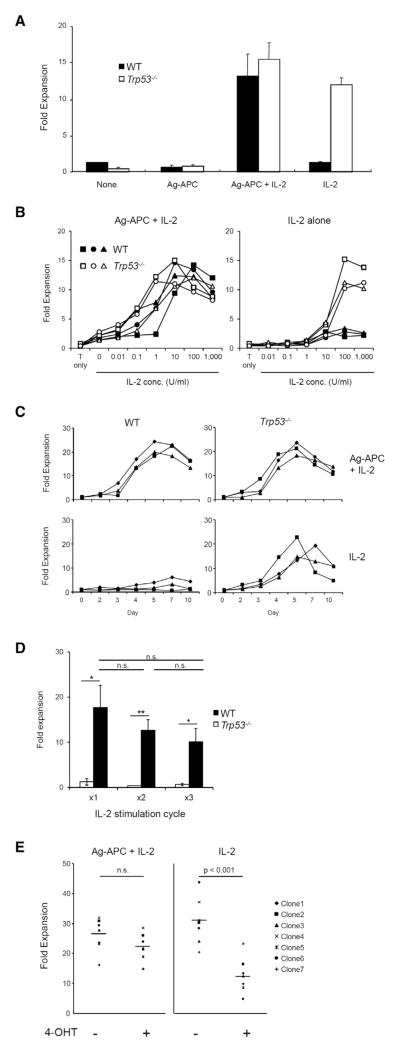
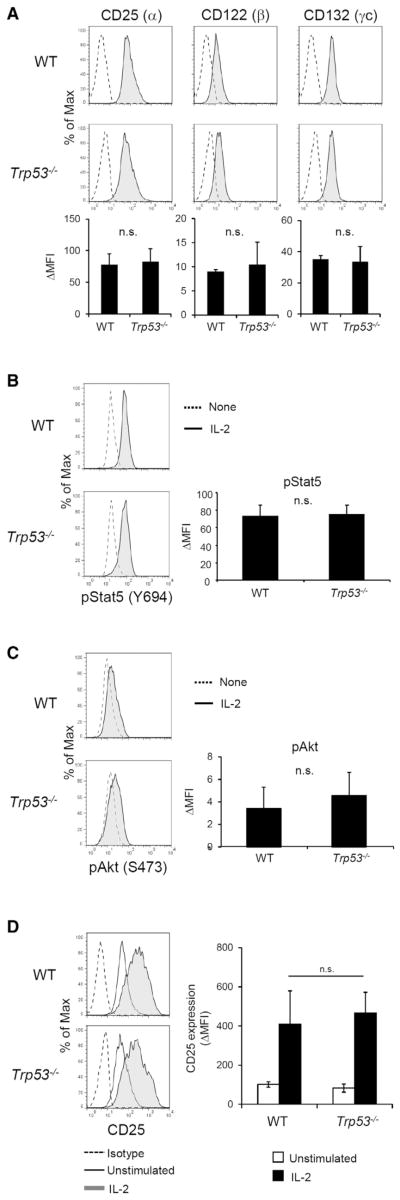
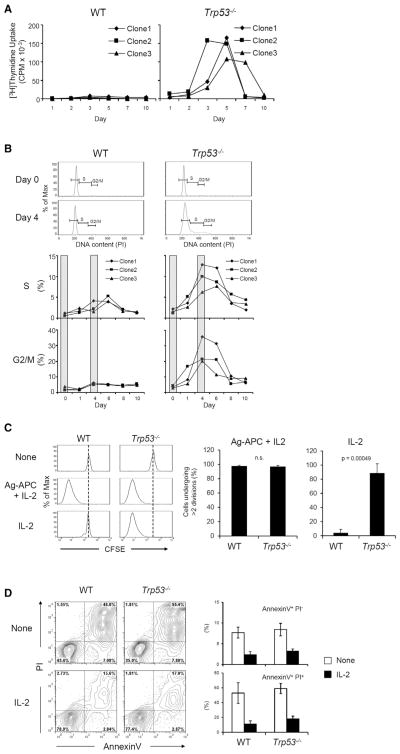
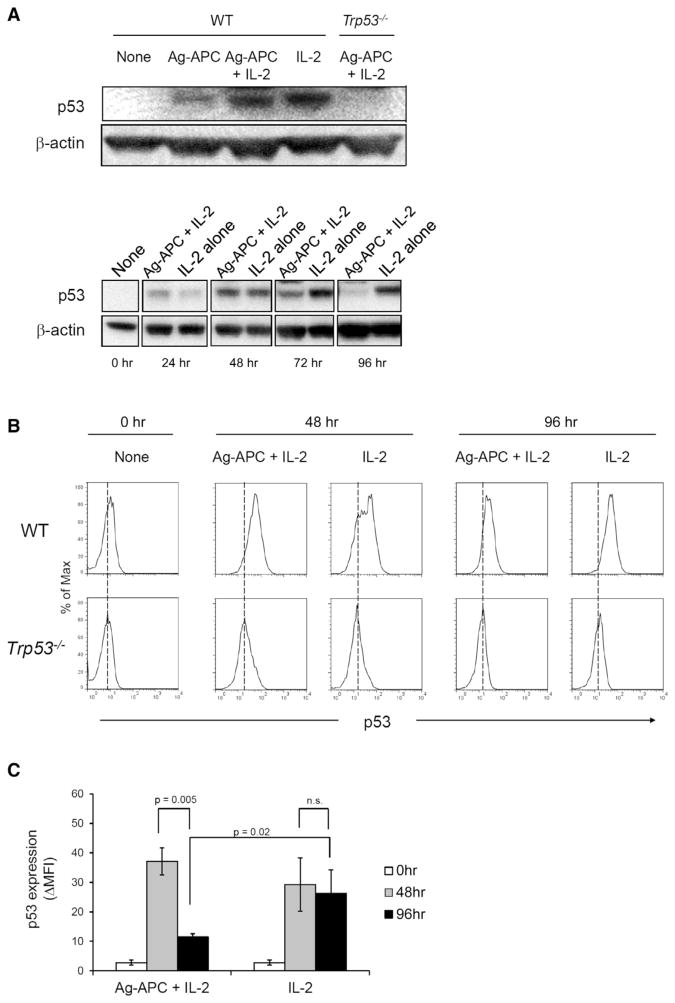
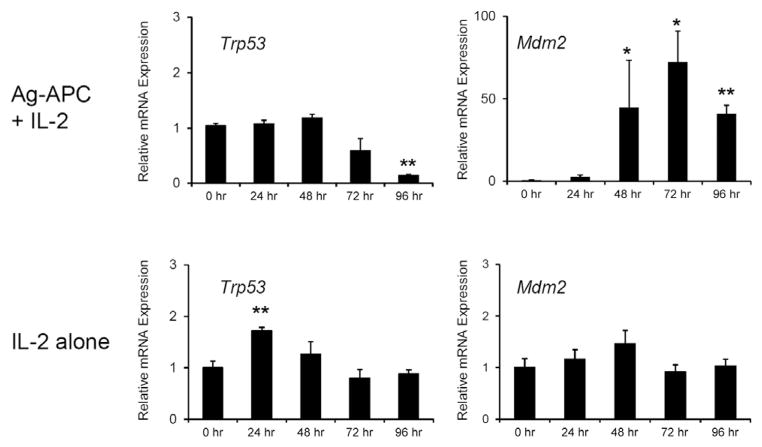
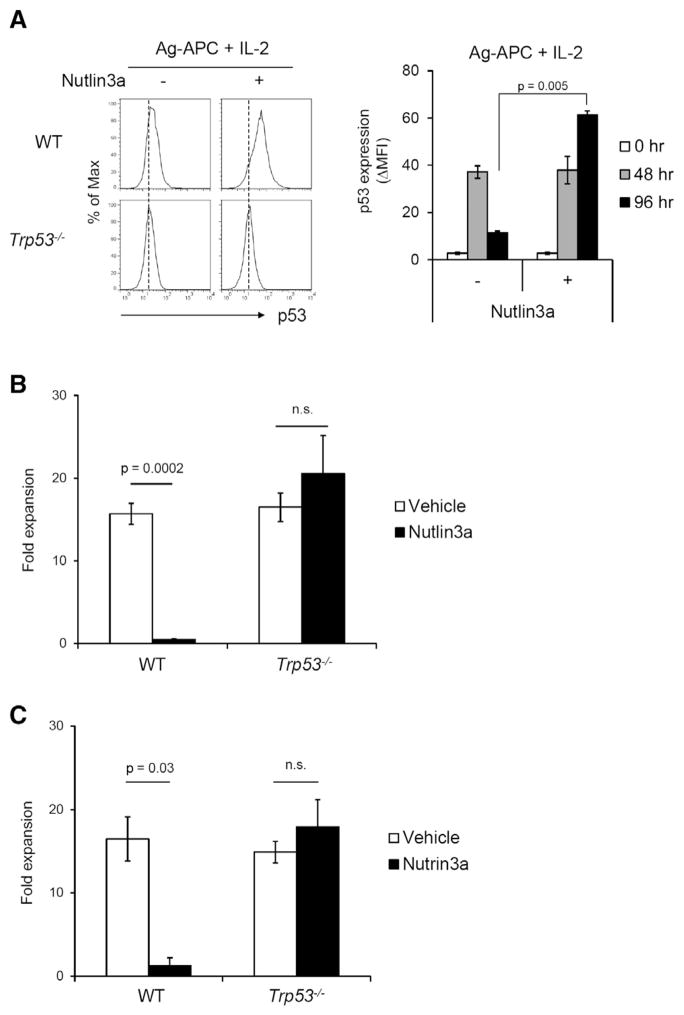
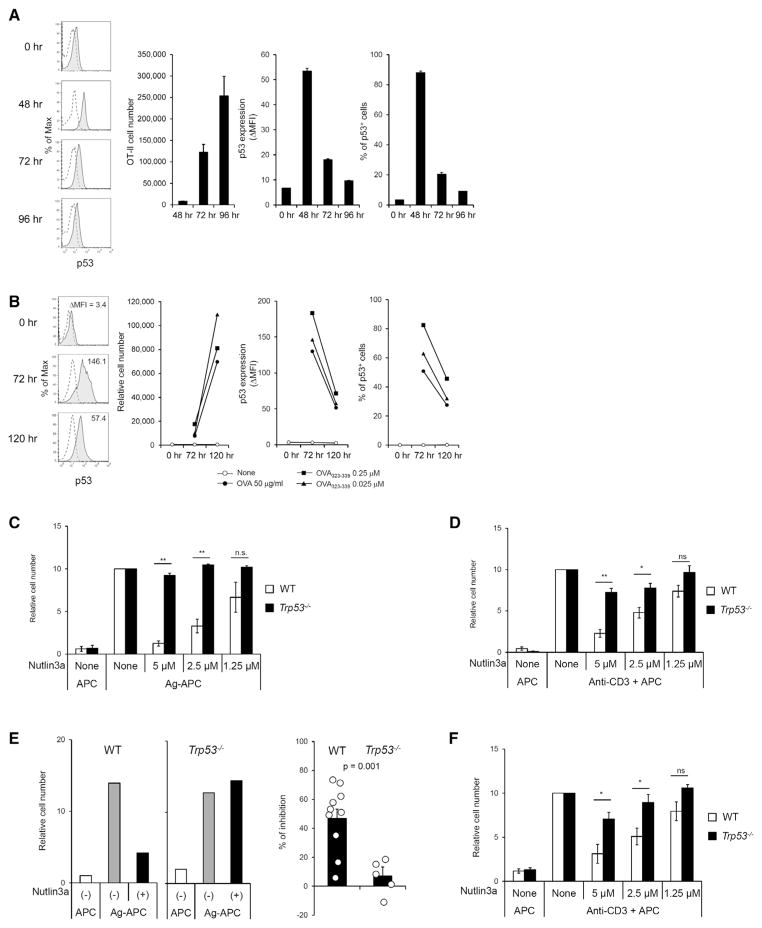
Antigen specificity is critical in immune response and requires integration of antigen-specific signals with antigen-nonspecific signals such as those provided by cytokines. The mechanism integrating these pathways is incompletely understood. We report here that antigen-specific proliferative responses of CD4(+) T cells required downmodulation of tumor suppressor p53. In the absence of T cell receptor (TCR) signal, IL-2 induced sustained increase in p53 protein, which prevented proliferative responses despite strong signaling through the IL-2 receptor. In contrast, TCR signaling resulted in early termination of p53 protein expression by decreasing p53 mRNA as well as strong transcriptional induction of the p53-regulating protein Mdm2. Downmodulation of p53 in response to antigen stimulation was in fact critical for antigen-specific T cell proliferation, and preventing p53 degradation by inhibiting Mdm2 resulted in sustained p53 protein and prevented antigen-specific T cell proliferation. It is thus termination of p53 by TCR signaling that allows proliferative responses, enforcing antigen specificity.


Figures

Figure 1
Figure 1. Antigen-Specific Trp53−/−, but Not WT, CD4+ T Cell Clones Proliferate in Response to IL-2 in the Absence of Antigenic Stimulation
(A) WT and Trp53−/− KLH-specific CD4+ T cell clones were cultured for 10 days under indicated conditions. Fold expansion was calculated as (recovered cell number/initial cell number). Mean ± SEM is shown (three clones per genotype). The data are representative of at least three independent experiments. (B) IL-2 dose response for cell expansion of WT and Trp53−/− CD4+ T clones. Three clones each of WT and Trp53−/− were stimulated under indicated conditions for 10 days and fold expansion was calculated. The graph is representative of two independent experiments. (C) Kinetic analysis of fold expansion of CD4+ T clones. Three clones each of WT and Trp53−/− were stimulated with Ag-APC + IL-2 or IL-2 alone, and fold expansion at indicated time points was calculated. The graph is representative of three independent experiments. (D) Three clones each of WT and Trp53−/− were stimulated with IL-2 alone for 10 days in 3 consecutive cycles without Ag-APC stimulation. Fold expansion was calculated at the end of each cycle. The graph is mean ± SEM and representative of at least three independent experiments. (E) KLH-specific CD4+ T cell clones established from p53ER-TAM mice were stimulated with Ag-APC + IL-2 or IL-2 alone in the presence or absence of 4-hydoroxy-tamoxifen (4-OHT) for 10 days and fold expansion was calculated. The data are representative of three independent experiments. *p < 0.05; **p < 0.01. See also Figure S1.
Figure 2
Figure 2. p53 Does Not Affect Proximal IL-2 Receptor Signaling
(A) IL-2 receptor expression of CD4+ T cell clones at resting state was analyzed by flow cytometry. In histograms, solid lines indicate specific staining and dashed lines indicate isotype control staining. The graphs are mean ± SEM of three clones each of WT and Trp53−/− and are representative of three independent experiments. n.s., no significant difference. (B) Induction of Stat5 phosphorylation upon IL-2 stimulation was analyzed by flow cytometry. Resting WT and Trp53−/−clones were stimulated with IL-2 (100 U/ml) for 15 min and then analyzed. In histograms, solid lines indicate pStat5 (Y694) staining of IL-2-stimulated cells and dashed lines indicate staining of unstimulated cells. The graph presents mean ± SEM of three clones each of WT and Trp53−/− and is representative of three independent experiments. (C) Induction of Akt phosphorylation upon IL-2 stimulation was analyzed by flow cytometry. Resting WT and Trp53−/− clones were stimulated with IL-2 for 15 min and then analyzed. In histogram, solid lines indicate pAkt (S473) staining of IL-2-stimulated cells and dashed lines indicate staining of unstimulated cells. The graph presents mean ± SEM of three clones each of WT and Trp53−/− and is representative of three independent experiments. (D) Induction of CD25 expression upon IL-2 stimulation. Resting WT and Trp53−/− clones were stimulated with IL-2 for 24 hr and then CD25 expression was analyzed by flow cytometry. Gray filled histograms indicate CD25 staining of IL-2-stimulated cells, open histograms indicate staining of unstimulated cells, and dashed lines indicate isotype control staining. The graph presents mean ± SEM of three clones each of WT and Trp53−/− and is representative of three independent experiments.
Figure 3
Figure 3. p53 Suppresses Cell Cycle Progression in Response to Stimulation with IL-2 Alone
(A) DNA synthesis of CD4+ clones upon IL-2 stimulation. WT and Trp53−/− clones were stimulated with IL-2 (100 U/ml), and DNA synthesis at indicated time points was analyzed by measuring [3H]thymi-dine incorporation. The result is representative of three independent experiments. (B) Cell cycle progression of CD4+ clones upon IL-2 stimulation. WT and Trp53−/− clones were stimulated with IL-2, and DNA content at indicated time points was analyzed by propidium iodide (PI) staining. The result is representative of two independent experiments. (C) Cell division of CD4+ clones upon IL-2 stimulation. WT and Trp53−/− clones were stained with CFSE and cultured under indicated conditions for 10 days. CFSE dilution was analyzed to evaluate cell division by flow cytometry. The graph indicates percent of cells dividing more than two times as mean ± SEM of three clones each of WT and Trp53−/−. The result is representative of three independent experiments. (D) Cell death of CD4+ clones upon IL-2 stimulation. WT and Trp53−/− clones were stimulated with IL-2 for 48 hr. Percent dead cells were evaluated with AnnexinV and PI staining by flow cytometry. The graphs shown are mean ± SEM of three clones each of WT and Trp53−/− and representative of two independent experiments.
Figure 4
Figure 4. Antigen Stimulation Downmodulates p53 Expression Induced by IL-2
(A) WT clones were stimulated for 48 hr (top) and for the indicated times up to 96 hr (bottom), and p53 protein was analyzed by immunoblotting. β-actin was used as internal control. The data are representative of three independent experiments. (B) WT and Trp53−/− clones were stimulated as indicated for 96 hr and p53 protein expression was analyzed by flow cytometry. Trp53−/− clones were used as a negative control for p53 staining. Results are representative of three independent experiments. (C) Statistical analysis of the results shown in (B). The graph presents means ± SEM of three clones each of WT and Trp53−/− and representative of three independent experiments.
Figure 5
Figure 5. Antigen Stimulation Induces Mdm2 and Termination of p53 Expression
Trp53 and Mdm2 mRNA expression upon stimulation with Ag-APC + IL-2 or IL-2 alone. KLH-specific clones were stimulated as indicated. mRNA expression was measured by real-time qPCR and normalized to Gapdh mRNA expression. The graphs are mean ± SEM of three WT clones and representative of three independent experiments.
Figure 6
Figure 6. Nutlin3a Prevents Downmodulation of p53 and Inhibits Antigen-Specific Proliferation of WT but Not Trp53−/− T Cell Clones
(A) Nutlin3a inhibits downmodulation of p53 protein expression after Ag-APC + IL-2 stimulation. KLH-specific WT CD4+ clones were stimulated with Ag-APC + IL-2 with or without Nutlin3a (5 μM) for 96 hr, and p53 protein expression was measured by flow cytometry. (B) The effect of Nutlin3a on cell expansion of KLH-specific CD4+ T clones. Three WT and three Trp53−/− clones were stimulated with Ag-APC + IL-2 for 8 days in the presence of Nutlin3a (5 μM) and fold expansion was calculated. The graph is mean ± SEM of three clones each of WT and Trp53−/− and is representative of three independent experiments. (C) The effect of Nutlin3a on cell expansion of OVA-specific CD4+ T lines. WT and Trp53−/− lines were stimulated with OVA323-339-APC + IL-2 with or without Nutlin3a (5 μM) for 8 days and fold expansion was calculated. The result is mean ± SEM of pool data of two independent experiments. *p < 0.05; **p < 0.01.
Figure 7
Figure 7. Downmodulation of p53 Is Necessary for Antigen-Specific Proliferation by Naive or Memory CD4+ T Cells
(A) p53 expression is initially upregulated, followed by downmodulation after in vivo antigen stimulation of CD4+ T cells. OT-II CD4+ T cells were adoptively transferred to CD45.1 mice followed by NP-OVA-Alum immunization. Cell number and p53 expression of OT-II cells were analyzed at the indicated time points. The graph is mean ± SEM (n = 3) and is representative of two independent experiments (total n = 5 mice analyzed individually). (B) p53 expression is initially upregulated, followed by downmodulation after in vitro antigen stimulation of naive OT-II CD4+ T cells. Naive OT-II CD4+ T cells were stimulated with OVA323-339-APC in vitro, and then cell number and p53 expression of OT-II cells were analyzed at the indicated time points. The data are representative of three independent experiments. (C) Naive WT or Trp53−/− OT-II CD4+ T cells were stimulated with OVA323-339-APC for 96 hr. Nutlin3a was added to the culture as indicated concentration at 24 hr after stimulation. Recovered live cell numbers are shown. The result is mean ± SEM of pool data of four independent experiments. (D) Naive B6 CD4+ T cells were stimulated with anti-CD3-APC for 96 hr. Nutlin3a was added to culture as indicated concentration at 24 hr after stimulation. Recovered live cell numbers are shown. The result is mean ± SEM of pool data of three independent experiments. (E) OT-II memory T cells were generated in vivo as described in Experimental Procedures and restimulated with OVA323-339-APC for 96 hr. Nutlin3a (2.5 μM) was added to the culture at 24 hr after stimulation. Representative result of recovered cell numbers is shown after stimulation with antigen in the presence or absence of Nutlin3a (left). Inhibitory effect of Nutlin3a for antigen-specific memory T cell proliferation is shown as percent inhibition (right). The results shown are mean ± SEM of pool data of three independent experiments (total WT; n = 10, Trp53−/−; n = 5). (F) Peripheral naturally occurring memory phenotype C57BL/6 CD4+ T cells (CD44hiCD62LloCD25) were stimulated with anti-CD3-APC for 96 hr. Nutlin3a was added to the culture as indicated at 24 hr after stimulation. Recovered cell numbers are shown. The result is mean ± SEM of pool data of three independent experiments. *p < 0.05; **p < 0.01. See also Figure S2.

Comment in

Similar articles

Cited by

References

    1. Boyman O, Sprent J. The role of interleukin-2 during homeostasis and activation of the immune system. Nat Rev Immunol. 2012;12:180–190. - PubMed
    1. Brady CA, Jiang D, Mello SS, Johnson TM, Jarvis LA, Kozak MM, Kenzelmann Broz D, Basak S, Park EJ, McLaughlin ME, et al. Distinct p53 transcriptional programs dictate acute DNA-damage responses and tumor suppression. Cell. 2011;145:571–583. - PMC - PubMed
    1. Chen D, Shan J, Zhu WG, Qin J, Gu W. Transcription-independent ARF regulation in oncogenic stress-mediated p53 responses. Nature. 2010;464:624–627. - PMC - PubMed
    1. Christophorou MA, Martin-Zanca D, Soucek L, Lawlor ER, Brown-Swigart L, Verschuren EW, Evan GI. Temporal dissection of p53 function in vitro and in vivo. Nat Genet. 2005;37:718–726. - PubMed
    1. Constant SL, Bottomly K. Induction of Th1 and Th2 CD4+ T cell responses: the alternative approaches. Annu Rev Immunol. 1997;15:297–322. - PubMed

Publication types

MeSH terms