. 2014 May 8;157(4):832-44.
doi: 10.1016/j.cell.2014.04.016. Epub 2014 May 1.

Tissue-specific signals control reversible program of localization and functional polarization of macrophages

Affiliations

Tissue-specific signals control reversible program of localization and functional polarization of macrophages

Yasutaka Okabe et al. Cell. .

Abstract

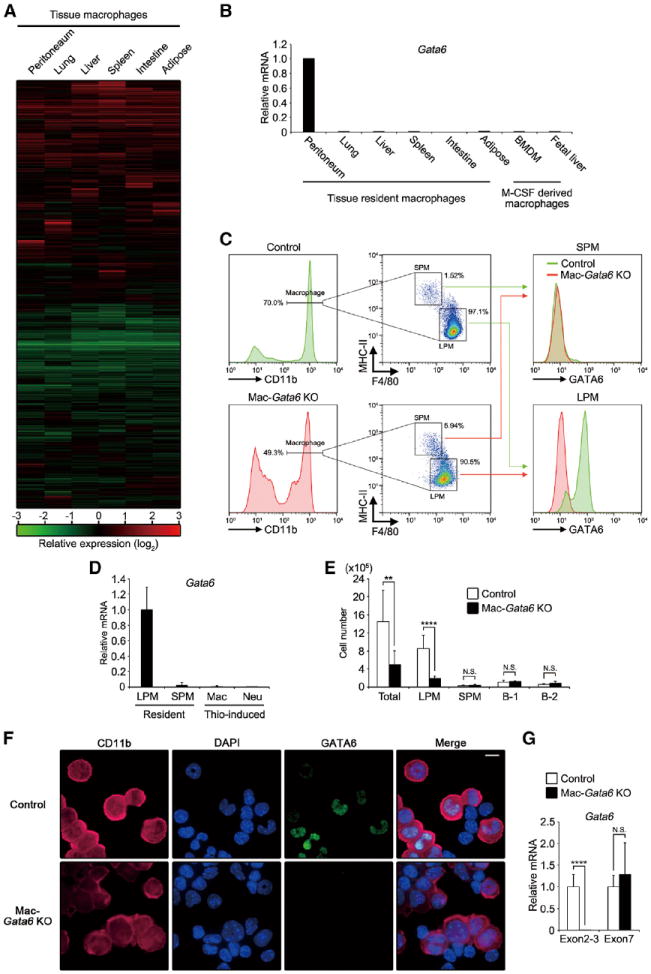
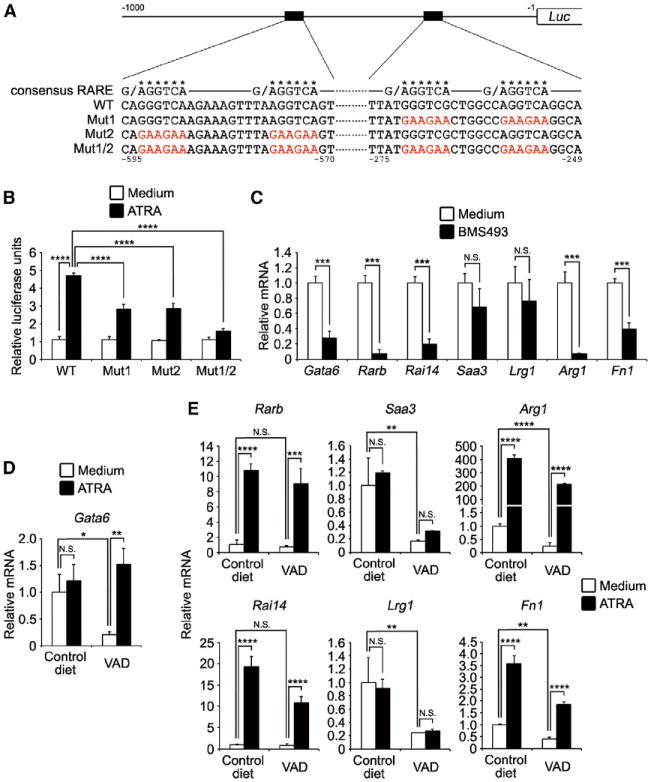
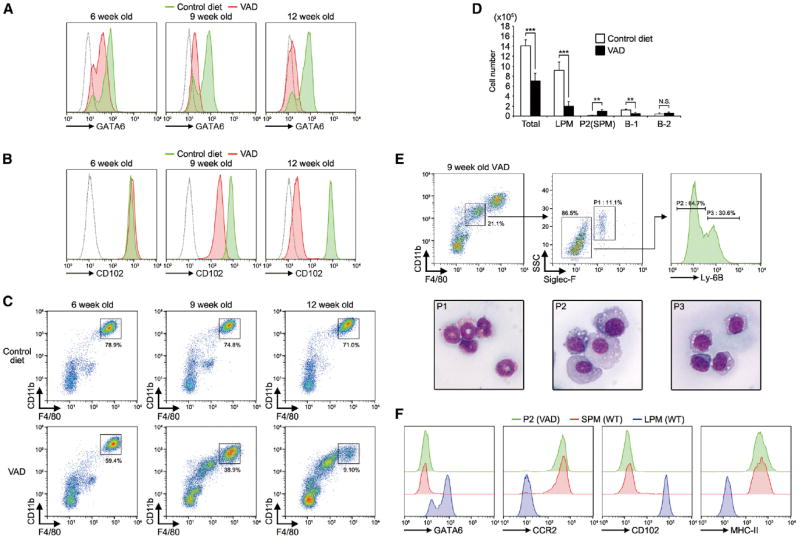
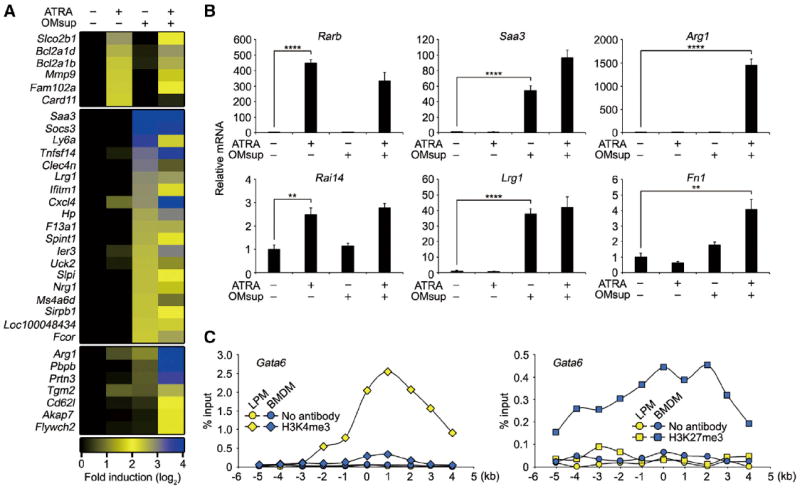
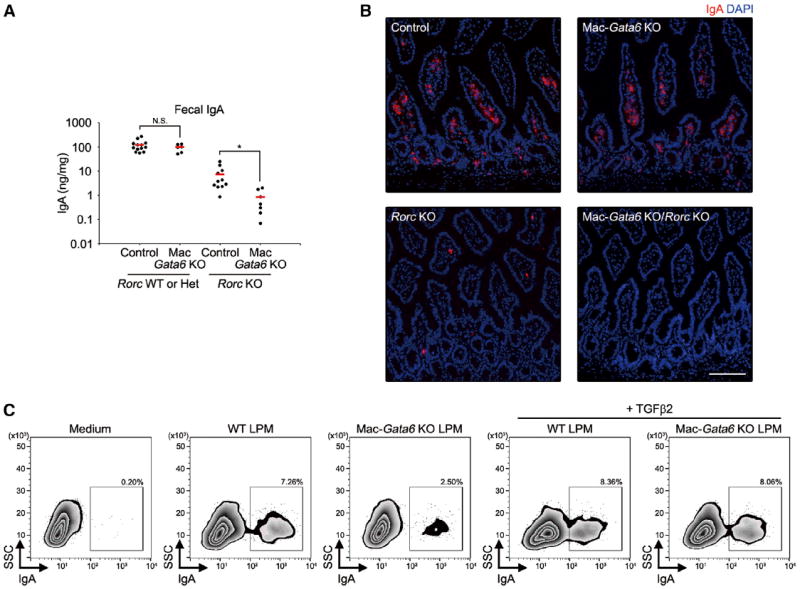
Tissue-resident macrophages are highly heterogeneous in terms of their functions and phenotypes as a consequence of adaptation to different tissue environments. Local tissue-derived signals are thought to control functional polarization of resident macrophages; however, the identity of these signals remains largely unknown. It is also unknown whether functional heterogeneity is a result of irreversible lineage-specific differentiation or a consequence of continuous but reversible induction of diverse functional programs. Here, we identified retinoic acid as a signal that induces tissue-specific localization and functional polarization of peritoneal macrophages through the reversible induction of transcription factor GATA6. We further found that GATA6 in macrophages regulates gut IgA production through peritoneal B-1 cells. These results provide insight into the regulation of tissue-resident macrophage functional specialization by tissue-derived signals.


Figures

Figure 1
Figure 1. Identification of GATA6 in Peritoneal Macrophages
(A) Heatmap displaying hierarchical clustering results from microarray expression data derived from tissue macrophages. Expression levels were normalized by that of BMDM and expressed by relative values (log-2). Genes whose signal was under detection limit were excluded, and 17,513 genes were shown. (B) Tissue macrophages and in-vitro-cultured macrophages were determined for Gata6 mRNA by quantitative PCR and were expressed as relative values normalized by Gapdh mRNA (n = 1). Graph is representative of two independent experiments. (C) (Left and middle) Flow cytometry analysis for macrophage subsets in peritoneal exudate cells of controls and Mac-Gata6 KO mice. (Right) Staining of GATA6 protein in SPMs and LPMs. (D) Quantitative PCR analysis for Gata6 mRNA in LPMs, SPMs, Thio-pMacs, and neutrophils (n = 3–12). (E) Numbers of total cells, LPM, SPM, B-1 cell, and B-2 cell in peritoneal exudate cells from controls and Mac-Gata6 KO mice (n = 6–12). Data were pooled from three independent experiments with similar results. (F) Immunofluorescence microscopy of peritoneal exudate cells from control and Mac-Gata6 KO mice stained for CD11b, DAPI, and GATA6. Scale bar, 10 μm. (G) Quantitative PCR analysis of LPMs for Gata6 mRNA targeting exons 2–3 and exon 7 (n = 6–12). Errors bars represent SD. **p < 0.01, ****p < 0.0001. N.S., not significant. See also Figure S1.
Figure 2
Figure 2. GATA6-Dependent PMSG Induction
(A) Heatmap of mRNA expressed at least five times over in peritoneal macrophages relative to their expression in all other tissue macrophages. Expression levels were shown as relative values normalized by that of BMDM. Note that apparent expression of Gata6 mRNA is due to the hybridization region (exon7) of microarray probe (refer to Figure 1G). (B and C) The mRNA expression of the indicated genes in tissue macrophages (B, representative of two independent experiments) and LPMs of littermate controls and Mac-Gata6 KO mice (C, n = 6–12) was determined by quantitative PCR and is expressed as a relative value to Gapdh mRNA. (D) Expression of indicated proteins in LPMs was analyzed by flow cytometry. Green, control; red, Mac-Gata6 KO; dotted line, unstained control. (E) mRNA expression of the indicated genes was determined in fetal liver-derived macrophages after retrovirus-mediated transduction of Gata6 (n = 3). Error bars represent SD. *p < 0.05, ***p < 0.001, ****p < 0.0001. N.S., not significant. See also Figure S2.
Figure 3
Figure 3. Activation of Gata6 Gene and Other PMSGs by Retinoic Acid
(A) Schematic diagram of Gata6 promoter constructs. Sequences of consensus retinoic acid response elements (RAREs) and putative RAR-binding regions in WT and mutants promoters were shown. Asterisks indicate positions of putative RAREs, and mutated nucleotides were shown by red. Numbers indicate position from Gata6 transcription start site. (B) 3T3 cells were transfected with GATA6 reporter plasmids and expression plasmids for RARβ and were then stimulated with 1 μM ATRA for 6 hr. The luciferase activities are shown as relative values (n = 3). (C) Peritoneal macrophages were cultured in the presence or absence of 1 μM BMS493 for 6 hr. The expression of PMSGs was determined by quantitative PCR (n = 3). (D and E) Peritoneal macrophages from 6-week-old mice bred with control diet or VAD were stimulated with 1 μM ATRA for 6 hr (D) or 24 hr (E), and then the expression of indicated genes was quantified (n = 3). Error bars represent SD. *p < 0.05, **p < 0.01, ***p < 0.001, ****p < 0.0001. N.S., not significant.
Figure 4
Figure 4. Essential Role of Vitamin A in PMSG Induction
(A and B) LPMs from mice fed with indicated diets were analyzed for GATA6 (A) and CD102 (B). Green, control diet; red, vitamin-A-deficient diet (VAD); dotted line, unstained control. The data are representative of at least three different mice in each group. (C) Flow cytometry profiles of peritoneal exudate cells from 6-, 9-, and 12-week-old mice bred with control diet or VAD. The data are representative of 3–8 different mice in each group. (D) Numbers of total cells, LPM, P2 (SPM), B-1 cells, and B-2 cells in peritoneal exudate cells from 9-week-old control diet and VAD mice (n = 5). Error bars represent SD. **p < 0.01, ***p < 0.001. N.S., not significant. (E) (Top) Flow cytometric gating strategy for characterization of F4/80-CD11b intermediate population. (Bottom) Wright and Giemsa staining of each of sorted subsets. (F) P2 population in (E) and SPMs and LPMs from WT C57BL/6 mice were analyzed for GATA6, CCR2, CD102, and MHC-II by flow cytometry. The data are representative of at least two different mice in each group. See also Figure S3.
Figure 5
Figure 5. Accumulation of Macrophages in Omenta of Mac-Gata6 and VAD Mice
(A) (Left) Omentum was illustrated by intraperitoneal injection of black carbon particles. (Right) Paraffin section of omentum from WT mouse was stained with hematoxylin and eosin (H&E). Clusters of leukocytes (milky spots) were indicated by arrows. Scale bar, 100 μm. (B) Indicated tissues were determined for Raldh2 mRNA by quantitative PCR and were expressed as relative values normalized by Gapdh mRNA (n = 3). (C) Milky spots of the omenta from control, Mac-Gata6 KO, 9-week-old VAD, and LPS-injected mice were stained as indicated color-coded lettering. Scale bars, 100 μm. (D) (Top) Omental cells from indicated mice were analyzed by flow cytometry. (Bottom) Macrophage population in top panels (gated) was analyzed for GATA6. Dotted line showed unstained control. Plots are representative of at least five different mice in each group. (E) Macrophages from omenta of VAD- or ATRA-treated VAD mice were analyzed for GATA6. Histogram is a representative of two different mice in each group. (F) Absolute cell numbers of LPMs present in the peritoneal exudate cells of indicated mice (n = 3) were counted 3 hr post-IP injection of saline or 10 mg of LPS. (G) Peritoneal macrophages from indicated mice were cultured for 2 hr on monolayers of mesothelial cells. Percentage of cells adherent to mesothelial cells was determined (n = 5). (H) (Upper-left) Schematic of mixed bone marrow transfer. Bone marrow cells from CD45.2 WT and that from Mac-Gata6 KO mice in macrophage-specific YFP-expressing strain (Mac-Yfp/Mac-Gata6 KO) were mixed at a ratio of 1:1 and were then injected into lethally irradiated CD45.1 WT recipients. (Upper-right) Percent chimerism of YFP+ macrophages in indicated tissues was shown (n = 4). (Bottom) Representative flow cytometry profiles for YFP were shown. YFP-positive population was gated. Error bars represent SD. **p < 0.01, ****p < 0.0001. See also Figure S4.
Figure 6
Figure 6. Induction of PMSGs by Omentum Factor
(A) Heatmap of microarray signals upregulated at least five times by 1 μM ATRA or OMsup stimulation compared to unstimulated sample and upregulated at least three times by a combination of ATRA and OMsup compared to individual stimulations after 24 hr. Expression levels were shown as fold induction to unstimulated BMDMs and were expressed by relative values (log-2). (B) BMDMs were cultured with 1 μM ATRA and/or OMsup for 24 hr. The expression of indicated genes was analyzed by quantitative PCR and expressed as relative values normalized by Gapdh mRNA (n = 3). (C) LPMs (yellow) and BMDM (blue) were analyzed by ChIP for Gata6 loci without antibody (circle) or with antibodies against H3K4me3 (diamond) or H3K27me3 (square). The data are represented as %input. The x axis depicts probe location on each loci relative to the transcription start site. Error bars represent SD. **p < 0.01, ****p < 0.0001. See also Figure S5.
Figure 7
Figure 7. GATA6 in Macrophage-Dependent Regulation of Gut IgA
(A) Fecal supernatant from unimmunized indicated mice (8 weeks old) were analyzed for IgA. Each point represents one mouse. Error bars represent mean values. *p < 0.05. N.S., not significant. (B) Immunohistochemistry analysis for small intestines of indicated mice. Red, IgA; blue, DAPI. Scale bars, 100 μm. (C) Flow cytometry analysis of IgA-positive peritoneal B-1 cells cultured with or without LPMs from WT or Mac-Gata6 KO mice and recombinant TGF-β2 in the presence of BAFF/LPS/ATRA for 4 days. See also Figure S6.

Comment in

Similar articles

Cited by

References

    1. A-Gonzalez N, Guillen JA, Gallardo G, Diaz M, de la Rosa JV, Hernandez IH, Casanova-Acebes M, Lopez F, Tabraue C, Beceiro S, et al. The nuclear receptor LXRα controls the functional specialization of splenic macrophages. Nat Immunol. 2013;14:831–839. - PMC - PubMed
    1. Ansel KM, Harris RB, Cyster JG. CXCL13 is required for B1 cell homing, natural antibody production, and body cavity immunity. Immunity. 2002;16:67–76. - PubMed
    1. Barth MW, Hendrzak JA, Melnicoff MJ, Morahan PS. Review of the macrophage disappearance reaction. J Leukoc Biol. 1995;57:361–367. - PubMed
    1. Baumgarth N. The double life of a B-1 cell: self-reactivity selects for protective effector functions. Nat Rev Immunol. 2011;11:34–46. - PubMed
    1. Biswas SK, Mantovani A. Macrophage plasticity and interaction with lymphocyte subsets: cancer as a paradigm. Nat Immunol. 2010;11:889–896. - PubMed

Publication types

Associated data