. 2014 Jul;85(4-5):411-28.
doi: 10.1007/s11103-014-0194-9. Epub 2014 May 3.

Integrated analysis of transcriptome and metabolome of Arabidopsis albino or pale green mutants with disrupted nuclear-encoded chloroplast proteins

Affiliations

Integrated analysis of transcriptome and metabolome of Arabidopsis albino or pale green mutants with disrupted nuclear-encoded chloroplast proteins

Masakazu Satou et al. Plant Mol Biol. 2014 Jul.

Abstract

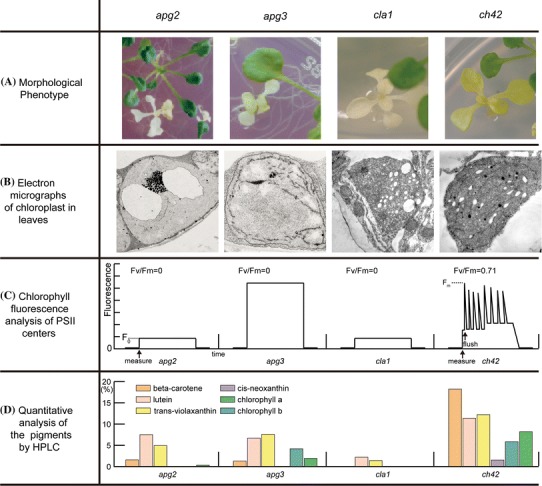
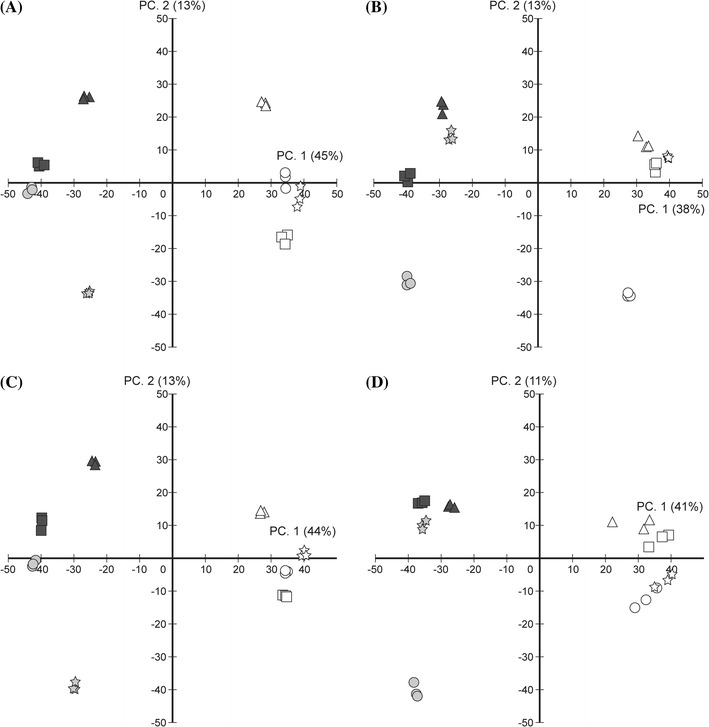
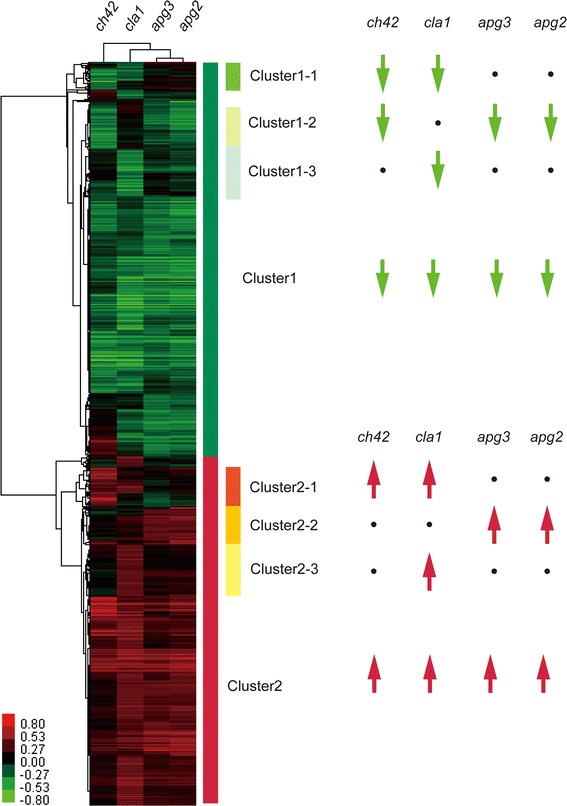
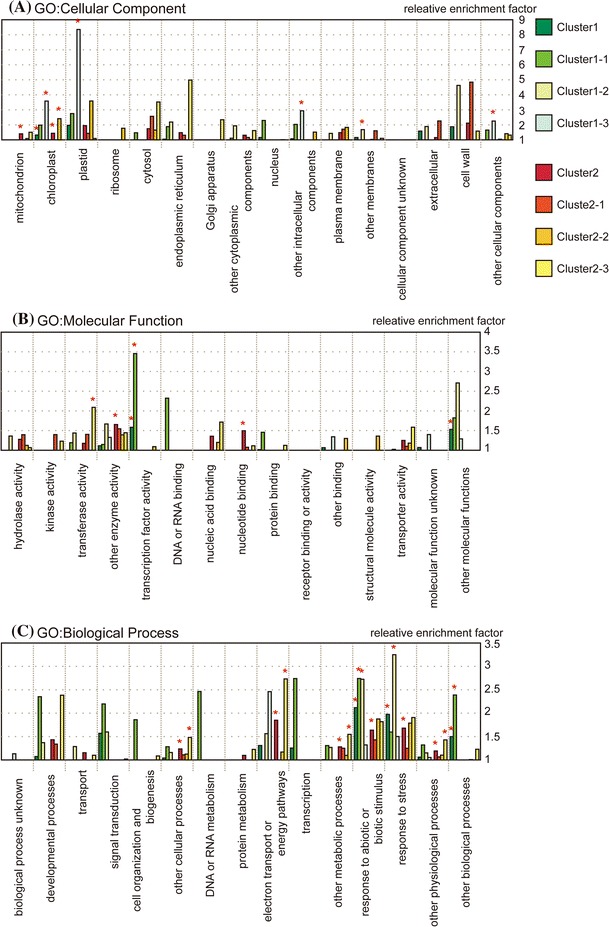
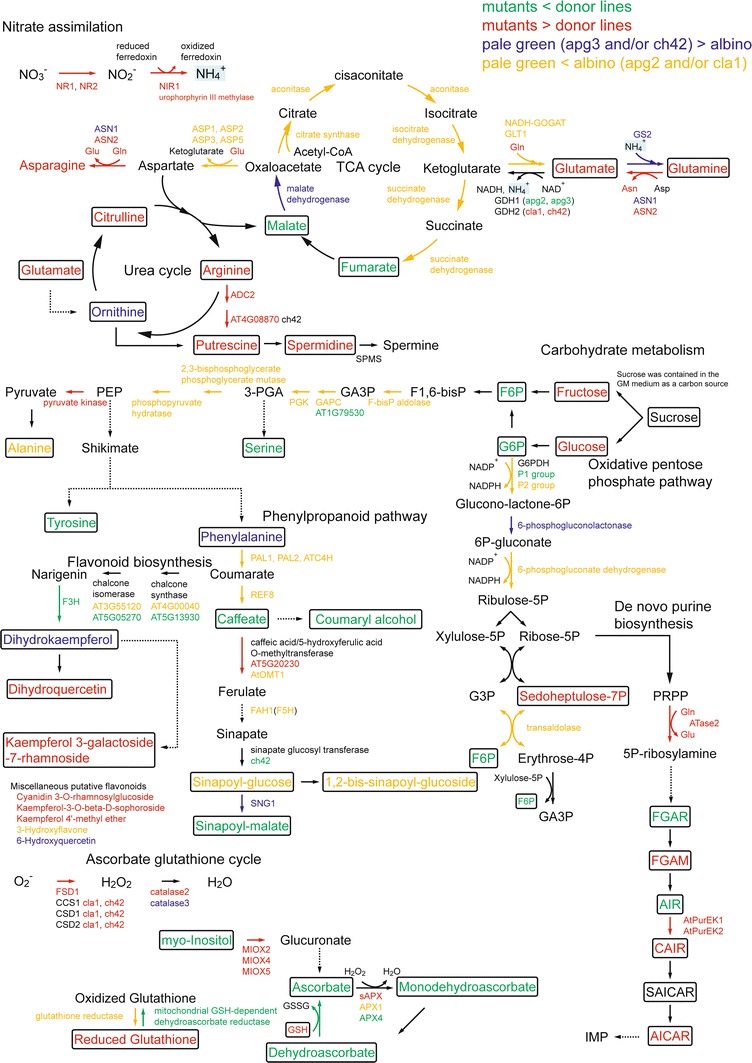
We used four mutants having albino or pale green phenotypes with disrupted nuclear-encoded chloroplast proteins to analyze the regulatory system of metabolites in chloroplast. We performed an integrated analyses of transcriptomes and metabolomes of the four mutants. Transcriptome analysis was carried out using the Agilent Arabidopsis 2 Oligo Microarray, and metabolome analysis with two mass spectrometers; a direct-infusion Fourier transform ion cyclotron resonance mass spectrometer (FT-ICR/MS) and a gas chromatograph-time of flight mass spectrometer. Among approximately 200 known metabolites detected by the FT-ICR/MS, 71 metabolites showed significant changes in the mutants when compared with controls (Ds donor plants). Significant accumulation of several amino acids (glutamine, glutamate and asparagine) was observed in the albino and pale green mutants. Transcriptome analysis revealed altered expressions of genes in several metabolic pathways. For example, genes involved in the tricarboxylic acid cycle, the oxidative pentose phosphate pathway, and the de novo purine nucleotide biosynthetic pathway were up-regulated. These results suggest that nitrogen assimilation is constitutively promoted in the albino and pale green mutants. The accumulation of ammonium ions in the albino and pale green mutants was consistently higher than in Ds donor lines. Furthermore, genes related to pyridoxin accumulation and the de novo purine nucleotide biosynthetic pathway were up-regulated, which may have occurred as a result of the accumulation of glutamine in the albino and pale green mutants. The difference in metabolic profiles seems to be correlated with the disruption of chloroplast internal membrane structures in the mutants. In albino mutants, the alteration of metabolites accumulation and genes expression is stronger than pale green mutants.


Figures

Fig. 1
Fig. 1
Summary of four apg mutants’ phenotypes that have been reported previously. a Morphological phenotype of the mutants that were grown for 21 days on GM medium containing 1 % sucrose. b Electron micrographs of leaf chloroplasts. c Schemes of chlorophyll fluorescence profiles measured by PAM. The values in each left top panel show Fv/Fm (=FmFo/Fm) indicating the state of PSII. d Bar plots show the relative abundance of five pigments compared with that of wild-type measured by HPLC
Fig. 2
Fig. 2
Biplot of Principal Component Analysis (PCA) applied for ESI-FT-ICR/MS. X-axis and Y-axis are principal component 1 (PC1) and principal component 2 (PC2), respectively. Solid circle is the apg2 mutant, unfilled circle is the apg2 Ds donor line, solid square is the apg3 mutant, unfilled square is the apg3 Ds donor line, solid star is the cla1 mutant, unfilled star is cla1 Ds donor line, solid triangle is the ch42 mutant, and unfilled triangle is the ch42 Ds donor line. Gray colored symbol is albino phenotype, black is pale-green phenotype. a Methanol extraction, positive charge mode measurement. b Methanol extraction, negative charge mode measurement. c Acetone extraction, positive charge mode measurement. d Acetone extraction, negative charge mode measurement.
Fig. 3
Fig. 3
GeneTree of Hierarchical Cluster Analysis applied for microarray gene expression profiles. The GeneTree was calculated from 2,812 significantly altered genes (FDR < 1−4). Gene expression in the mutants higher and lower than those of the Ds donor lines are shown in red and green, respectively. Eight clusters were chosen based on their expression and their profiles were displayed as arrow symbols on the right panel. The altered genes were divided between 1,490 up-regulated genes as cluster1, and 1,322 down-regulated genes as cluster2. We extracted three subclusters from each of cluster1 and cluster2. Cluster1-1 (ch42 down-regulated, cla1 down-regulated, apg3 not changed, apg2 not changed), cluster1-2 (ch42 down-regulated, cla1 not changed, apg3 down-regulated, apg2 down-regulated), cluster1-3 (ch42 not changed, cla1 down-regulated, apg3 not changed, apg2 not changed) and cluster2-1 (ch42 up-regulated, cla1 up-regulated, apg3 not changed, apg2 not changed), cluster2-2 (ch42 not changed, cla1 not changed, apg3 up-regulated, apg2 up-regulated), cluster2-3 (ch42 not changed, cla1 up-regulated, apg3 not changed, apg2 not changed) were extracted from the two clusters
Fig. 4
Fig. 4
Functional classification of gene clusters based on GO Slim. Bar plot represents the relative enrichment factor that is the odds ratio of GO class corresponding genes in a cluster, compared with those in overall Arabidopsis. Asterisked GO classes were statistically significant (FDR < 10−4) in each of the three GO categories a Cellular Component, b Molecular Function, c Biological Process
Fig. 5
Fig. 5
The scheme of metabolic pathways determined using metabolome analysis and transcriptome analysis. Boxed compounds indicate metabolites detected by the FT-ICR/MS or GC-TOF/MS. Solid arrows connected by compounds indicate an enzyme reaction. Dashed lines indicate abbreviation of several enzyme reactions. Colors of compounds and enzyme reactions indicate the relative abundance as indicated by mass spectrometers and gene expression by microarray, respectively. The following color codes are used: green, reduction of transcripts and metabolites in the mutants rather than Ds donor lines; red, accumulation of transcripts and metabolites in the mutants rather than Ds donor lines; blue, accumulation of transcripts and metabolites in the pale-green mutants (apg3, ch42) rather than albino mutants (apg2, cla1) or accumulation only in the ch42 mutant; yellow, accumulation of transcripts and metabolites in the albino mutants (apg2, cla1) rather than pale-green mutants (apg3, ch42) or accumulation only in the cla1 mutant

Similar articles

Cited by

References

    1. Aharoni A, Ric de Vos CH, Verhoeven HA, Maliepaard CA, Kruppa G, Bino R, Goodenowe DB. Nontargeted metabolome analysis by use of Fourier Transform Ion Cyclotron Mass Spectrometry. OMICS. 2002;6:217–234. doi: 10.1089/15362310260256882. - DOI - PubMed
    1. Baginsky S, Gruissem W. Arabidopsis thaliana proteomics: from proteome to genome. J Exp Bot. 2006;57:1485–1491. doi: 10.1093/jxb/erj130. - DOI - PubMed
    1. Booij-James IS, Dube SK, Jansen MA, Edelman M, Mattoo AK. Ultraviolet-B radiation impacts light-mediated turnover of the photosystem II reaction center heterodimer in Arabidopsis mutants altered in phenolic metabolism. Plant Physiol. 2000;124:1275–1284. doi: 10.1104/pp.124.3.1275. - DOI - PMC - PubMed
    1. Bräutigam A, Gagneul D, Weber APM. High-throughput colorimetric method for the parallel assay of glyoxylic acid and ammonium in a single extract. Anal Biochem. 2007;362:151–153. doi: 10.1016/j.ab.2006.12.033. - DOI - PubMed
    1. Caldana C, Degenkolbe T, Cuadros-Inostroza A, Klie S, Sulpice R, Leisse A, et al. High-density kinetic analysis of the metabolomic and transcriptomic response of Arabidopsis to eight environmental conditions. Plant J. 2011;67:869–884. doi: 10.1111/j.1365-313X.2011.04640.x. - DOI - PubMed

Publication types

MeSH terms