. 2014 Jun;17(6):813-21.
doi: 10.1038/nn.3715. Epub 2014 May 4.

Aberrant topoisomerase-1 DNA lesions are pathogenic in neurodegenerative genome instability syndromes

Affiliations

Aberrant topoisomerase-1 DNA lesions are pathogenic in neurodegenerative genome instability syndromes

Sachin Katyal et al. Nat Neurosci. 2014 Jun.

Abstract

DNA damage is considered to be a prime factor in several spinocerebellar neurodegenerative diseases; however, the DNA lesions underpinning disease etiology are unknown. We observed the endogenous accumulation of pathogenic topoisomerase-1 (Top1)-DNA cleavage complexes (Top1ccs) in murine models of ataxia telangiectasia and spinocerebellar ataxia with axonal neuropathy 1. We found that the defective DNA damage response factors in these two diseases cooperatively modulated Top1cc turnover in a non-epistatic and ATM kinase-independent manner. Furthermore, coincident neural inactivation of ATM and DNA single-strand break repair factors, including tyrosyl-DNA phosphodiesterase-1 or XRCC1, resulted in increased Top1cc formation and excessive DNA damage and neurodevelopmental defects. Notably, direct Top1 poisoning to elevate Top1cc levels phenocopied the neuropathology of the mouse models described above. Our results identify a critical endogenous pathogenic lesion associated with neurodegenerative syndromes arising from DNA repair deficiency, indicating that genome integrity is important for preventing disease in the nervous system.


Figures
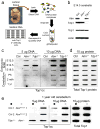
Fig. 1
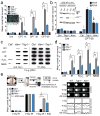
Fig. 1. Atm prevents Top1cc accumulation in vivo.
a. Schematic of the in vivo complex of enzyme bioassay (ICE assay) following immunodetection with anti-topoisomerase-1 antibody. b. Western analysis indicating the corresponding genotypes of the CNS tissue used for the ICE bioassay. The anti-Top1 immunoblot shows equivalent amounts of Top1 protein amongst cerebella tissue and validates the high-specificity of the antibody. Full-length Western blots are presented in Supplementary Figure 11. c. Genomic DNA was slot-blotted with the indicated amounts (μg) of genomic DNA (a proportion of which is complexed with Top1) isolated from the embryonal brain and postnatal and mature cerebellum. Top1cc were immunodetected with anti-Top1 antibody. Atm−/− embryonic brain and cerebellum showed significant accumulation of Top1cc compared to controls. Top1cc also accumulate in Tdp1−/− neural tissue, due to defects in Top1-DNA cleavage, and serve as a comparative positive control. Embryonic tissue used in ICE assays are derived from gDNA pooled from 3 independent embryos. d. 10 μg of protein extract derived from tissues analyzed in ‘c’ and were immunoblotted to normalize total Top1 protein content. Top1 levels were equivalent amongst WT, Atm−/− and Tdp1−/− tissues at each neurodevelopmental stage. e. One year old ATM-deficient (Atm−/− and AtmNes-cre) cerebella show substantial Top1cc levels, indicating a requirement for Atm in the resolution of Top1-DNA intermediates in the mature nervous system.
Fig. 2
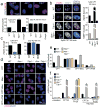
Fig. 2. Atm is required for the normal response to the topoisomerase 1 poison, camptothecin
a. The repair kinetics of quiescent astrocytes following treatment with the Topoisomerase-1 poison camptothecin (CPT) at the indicated time points is shown. Although Top1-induced DNA breaks are repaired more slowly in Atm−/− astrocytes, deficiency in the related kinase, DNA-dependent protein kinase, catalytic subunit (Prkdc−/−) results in comparable DNA single-strand break repair rates as wild-type (Ctrl) astrocytes. Inset panel shows quiescent GFAP-positive Atm−/− astrocytes. b. Inhibiting Atm kinase activity fails to recapitulate the repair defect observed in Atm−/− cells after CPT. Western blot analysis (inset) of irradiated wild type (Ctrl) astrocytes co-treated with 10 μM ATM inhibitor KU55933 (ATMi) and radiation confirms Atm inhibition by defective DNA damage-induced Chk2 modification (black arrows) and p53 phosphorylation in Atm−/− cerebella and astrocytes. NBS1 was used as a loading control. Comet analysis (bar graph) indicates Atm−/− astrocytes (red arrow) accumulate significantly more CPT-induced DNA damage than ATMi-treated ctrl astrocytes (yellow arrow), indicating ATM kinase-independent repair of Top1-DNA lesions. Full-length Western blots are presented in Supplementary Figure 11. c. ICE analysis of quiescent primary murine astrocytes following treatment with DNA damaging agents can result in accumulation of Top1cc. Treatment conditions were; 14 μm CPT for 60 mins at 37°C; 20Gy IR followed by 60 mins recovery at 37°C; 150 μm H2O2 for 5 mins at 4°C followed by 60 mins recovery at 37°C; 0.20 mg/ml MMS for 10 mins at 37°C. Top1cc were identified by blotting genomic DNA with anti-Top1 and gDNA levels were assessed by re-probing with 32P-labelled mouse ES cell genomic DNA (32P-DNA). d. Alkaline comet analysis of quiescent Atm−/− astrocytes show defective DNA single-strand break repair after treatments listed for ‘c’. For each in vitro comet assay, 100 cells/comet corresponding to each genotype and treatment were analyzed and experiments were performed in triplicate (total of n=300 cells/genotype/treatment). e. In vivo comet analysis comparing relative DNA strand break repair rates amongst ctrl, Atm−/− and Tdp1−/− cerebellar granule cell neurons following ionizing radiation (15 Gy) and a 30 min recovery. Bar graphs represent mean comet tail moments from experiments that were repeated in duplicate (2 mice/treatment) with cells isolated from each cerebella also measured in duplicate (total n=400 independent comet tail moments measured per line/treatment); error bars represent standard error of means (S.E.M.). Scatterplots indicate representative cellular comet tail moments from each corresponding cell/treatment type. For all graphs */** denotes p-values < 0.0001.
Fig. 3
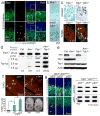
Fig. 3. Atm modulates Top1 turnover after CPT treatment
a. Top 1 levels are higher in Atm−/− astrocytes compared to WT cells after CPT. The proteasome inhibitor MG132 inhibited Top1 turnover after CPT treatment in control cells. Top1cc levels as determined by the ICE assay correspond to CPT-induced trapping of Top1-DNA and reduced Top1 turnover. Top1/Top1cc quantitation is normalized to untreated control (Ctrl) levels. b. Treatment with MG132 increased the levels of DNA damage, particularly in control cells. c. MG132 also dampened Atm-dependent signaling as shown by decreased Atm and Kap1 phosphorylation. Total Kap1 and Gfap levels show equal protein loading. d. Poly-ubiquitin immunoblots of immunoprecipitated Top1 show that ubiquitination of Top1 is markedly reduced in human A-T lymphoblastoid cells, and that these ubiquitin levels are unaffected by either CPT or KU55933 treatment. Top1 immunoprecipitated from CPT-treated control cells and blotted with Top1 antibodies showed that Top1 migrated as a collection of higher molecular weight species (red asterisks) reflecting Top1 posttranslational modification (Top1PTM). Reduced amounts of post-translationally modified Top1 are found in Top1 immunoprecipitates from ATM−/− lymphoid cells after CPT-treatment. Like CPT-treated control cells, a comparable amount of Top1 is immunoprecipitated from CPT/KU55933 co-treated control lymphoblasts. Immunoblots of extracts prior to immunoprecipitation show reduced total Top1 expression in CPT-treated control cells (black arrows) compared to other cell-types and treatments. e. High molecular weight Top1 bands from Top1 immunoprecipitates are immununoreactive to anti-SUMO1 antibody (red asterisks), thus indicating that Top1 undergoes poly-sumoylation (Top1pSUMO1). In ATM−/− cells, Top1pSUMO1 is reduced after CPT-treatment, while similar to CPT-treated control cells, a comparable amount of Top1pSUMO1 is immunoprecipitated from CPT/KU55933 co-treated control lymphoblasts. f. Western blots indicate absence of ATM in A-T cells, while KU55933 treatment of control cells showed defective CHK2 phosphorylation after CPT treatment, indicating effective ATM inhibition. Full-length Western blots are presented in Supplementary Figure 11.
Fig. 4
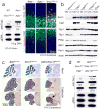
Fig. 4. Atm is essential for DNA damage signaling after CPT treatment
a. Primary Atm−/− astrocytes form few γH2AX foci after CPT treatment (5 μM for 60 min) while abundant γH2AX foci are seen in WT and Tdp1−/− astrocytes. All genotypes show equivalent levels of γH2AX after IR. Upper panels show immunofluorescence analysis of typical γH2AX foci, which are quantified in the graphs below, as are the foci observed after IR. b. Similar to astrocytes, murine embryonic fibroblasts (MEFs) also exhibit Atm-dependent γH2AX after CPT. 53BP1 foci also show a similar induction after CPT and co-localize with γH2AX foci; these data are quantified in the adjacent graphs. c. In contrast to ATM−/− cells (A-T), the loss of NBS1 does not affect γH2AX foci formation upon CPT treatment. d. While bleomycin treatment (10 μg/ml 30 mins) induces γH2AX foci at similar levels in WT, Atm−/− and Tdp1−/− cells, pre-treatment with CPT prevents bleomycin-induced γH2AX foci formation in Atm−/− and Atm−/−;Tdp1−/− cells. The ATM inhibitor (ATMi) KU55933 prevents CPT-induced γH2AX foci formation indicating that Atm kinase activity is required for H2AX phosphorylation. e. Quantitation of γH2AX foci/cell for the different treatments and genotypes presented in ‘d’ is shown. f. When CPT treated (5μM CPT, 60mins) Atm−/− or Atm−/−;Tdp1−/− cells MEFs are subsequently incubated with CPT-free media, DNA damage signaling is activated in a DNA-dependent protein kinase, catalytic subunit (DNA-PKcs/Prkdc)-dependent manner as γH2AX foci fail to form in the presence of the DNA-PKcs inhibitor, NU7441 (2μM). For all foci quantification experiments, 30 cells for each cell line and corresponding treatment were counted and experiments were repeated in quadruplicate (total n=120 independent cells measured per line/treatment). Bar graphs represent mean cellular foci values of all replicates, error bars represent standard error of means (S.E.M.) and p-value is calculated using student’s unpaired t-test. The y-axis on graphs in ‘b’ and ‘f’ is non-linear to indicate increased foci number in specific genotypes after DNA damage.
Fig. 5
Fig. 5. Compound Atm−/− and Tdp1−/− mutants are usually lethal during development
a. Analysis of the E14.5 Atm−/−;Tdp1−/− developing nervous system reveals an accumulation of DNA breaks (γH2AX; arrowheads). In the double-deficient embryonal brain, pronounced γH2AX foci (red signal demarcated by yellow arrowheads) are noted in the forebrain whereas few foci are noted in the Atm−/− control brain. PCNA immunostaining (green) identifies proliferating cells in the ventricular zone of the neocortex. b. Similarly, abundant anti-p53 immunoreactivity (arrowheads) is present in the in the ventricular zone of Atm−/−;Tdp1−/− embryonal forebrain, but are absent in the Atm−/− control. c. Apoptosis occurs early during neurogenesis in the Atm−/− ;Tdp1−/− forebrain, as at E12.5 activated caspase-3 staining and TUNEL (white arrows) is abundant. d. ICE analysis of Top1cc in the E14.5 embryonic brain. 20 μg of whole cell extract derived from E14.5 brain tissue were blotted (first row) to normalize total Topoisomerase-1 protein content amongst the E14.5 CNS tissue. The remaining three rows were blotted with increasing amounts (μg) of genomic DNA isolated from these tissues. Top1cc were immunodetected in genomic DNA (gDNA) using an anti-Top1 antibody. Relative Top1cc levels in Atm−/−;Tdp1−/− embryonal brain compared to controls (Ctrl, Atm−/− and Tdp1−/−) is listed below the blot. Embryonic tissue used in ICE assays are derived from gDNA pooled from 3 independent embryos. e. Western blot analysis of E14.5 Atm−/−;Tdp1−/− neural tissue used for ICE bioassay confirming tissue genotypes and the equivalent amounts of Top1 protein amongst the genotypes for ICE analysis. Full-length Western blots are presented in Supplementary Figure 11. f. Exposure of E12.5 embryos to topotecan results in apoptosis throughout the developing nervous system by E14.5. The graph shows levels of TUNEL positive cells in wild type and the relative increase in apoptosis in Atm−/− after topotecan injections of E12.5 embryos. For quantification, n=2 embryos for each genotype were analyzed. Bar graphs represent mean immunopositive cells for TUNEL or active caspase-3 measured within 0.27mm2 from three representative sections of the neocortex per embryo (total of n=6). Error bars represent standard error of means (S.E.M.) and statistics were calculated using unpaired student’s t-test. g. Disrupted neurogenesis and associated apoptosis after coincident Atm and Tdp1 deletion is prevented when p53 is attenuated via single or dual allele inactivation. Arrows indicate TUNEL positive cells. PCNA immunostaining identifies proliferating cells, while Tuj1 immunostaining identifies differentiating neurons. Top1cc levels in the E14.5 brain are not different in the presence or absence of apoptosis. For all graphs * denotes p-values < 0.001.
Fig. 6
Fig. 6. Top1cc can arise in the nervous system in response to DNA damage
a. Neural inactivation of Xrcc1 but not Aptx results in elevated Top1cc during development. Values for the ICE assay indicate relative signal compared to wild type (WT). Loss of Xrcc1, but not Atm or Aptx results in increased γH2AX foci, although these were not associated with widespread apoptosis. PCNA immunostaining identifies proliferating cells, while Tuj1 immunostaining identifies differentiating neurons. b. Western blot analysis of base excision repair factors shows that while Xrcc1 loss leads to destabilization of Lig3, other factors such as Tdp1 and Top1 are present at normal levels. Other mutant genotypes serve as controls for protein immuno-detection; Ctx is P5 cortex and Ce is P5 cerebellum. Full-length Western blots are presented in Supplementary Figure 11. c. The P16 (Atm;Xrcc1)Nes-cre cerebellum is markedly affected during neural development (arrow). Nissl staining shows general cerebellar morphology, while calbindin immunostaining identifies Purkinje cells. Bottom panels show a more lateral section of the cerebellum. d. Dual inactivation of Atm and Xrcc1 results in elevated Top1cc levels in the P16 cerebellum. Values for the ICE assay indicate relative signal compared to WT.

Similar articles

Cited by

References

    1. McKinnon PJ. DNA repair deficiency and neurological disease. Nat Rev Neurosci. 2009;10:100–112. - PMC - PubMed
    1. Jackson SP, Bartek J. The DNA-damage response in human biology and disease. Nature. 2009;461:1071–1078. - PMC - PubMed
    1. O’Driscoll M, Jeggo PA. The role of double-strand break repair - insights from human genetics. Nat Rev Genet. 2006;7:45–54. - PubMed
    1. McKinnon PJ. Maintaining genome stability in the nervous system. Nat Neurosci. 2013;16:1523–1529. - PMC - PubMed
    1. Shull ER, et al. Differential DNA damage signaling accounts for distinct neural apoptotic responses in ATLD and NBS. Genes Dev. 2009;23:171–180. - PMC - PubMed

Publication types

Substances