. 2014 Jul;197(3):865-83.
doi: 10.1534/genetics.114.163311. Epub 2014 May 2.

Sex-biased gene expression and evolution of the x chromosome in nematodes

Affiliations

Sex-biased gene expression and evolution of the x chromosome in nematodes

Sarah Elizabeth Albritton et al. Genetics. 2014 Jul.

Abstract

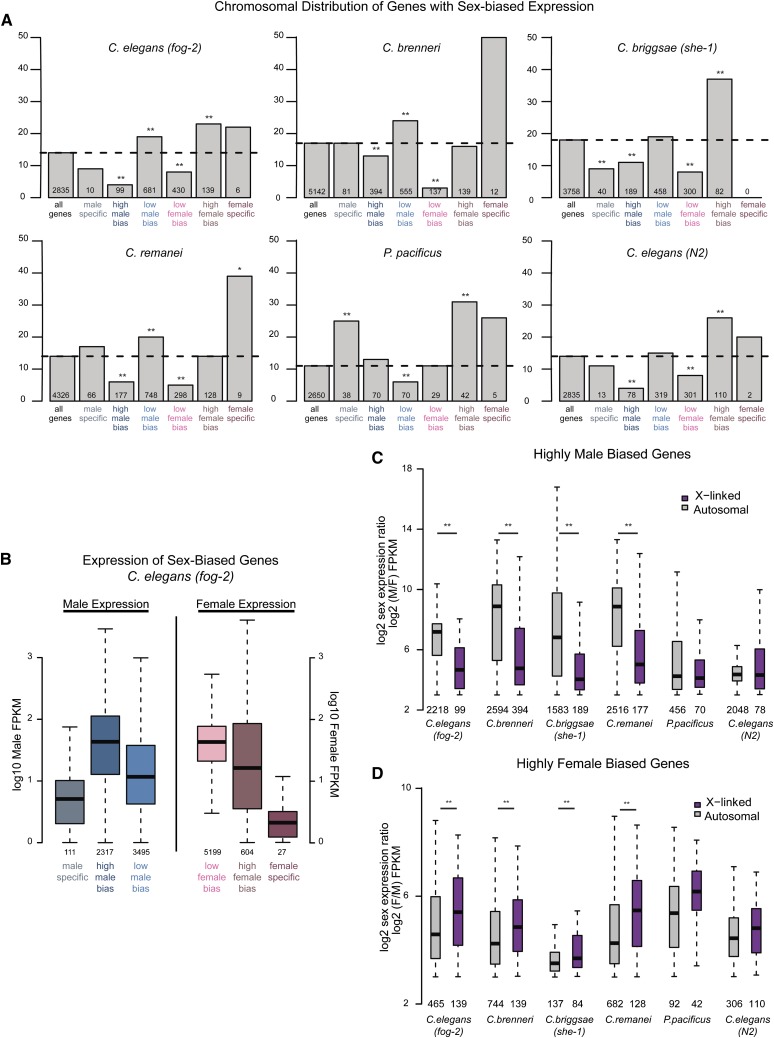
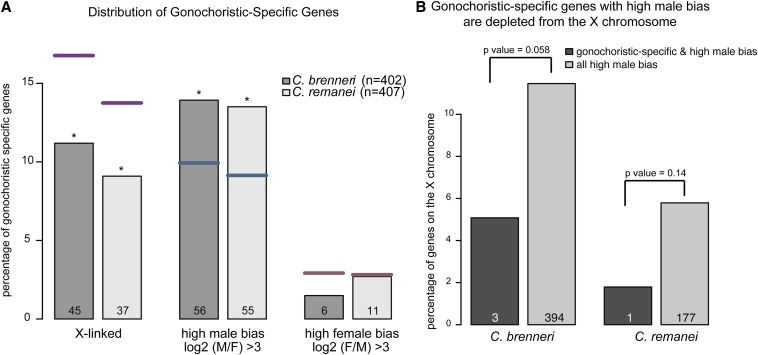
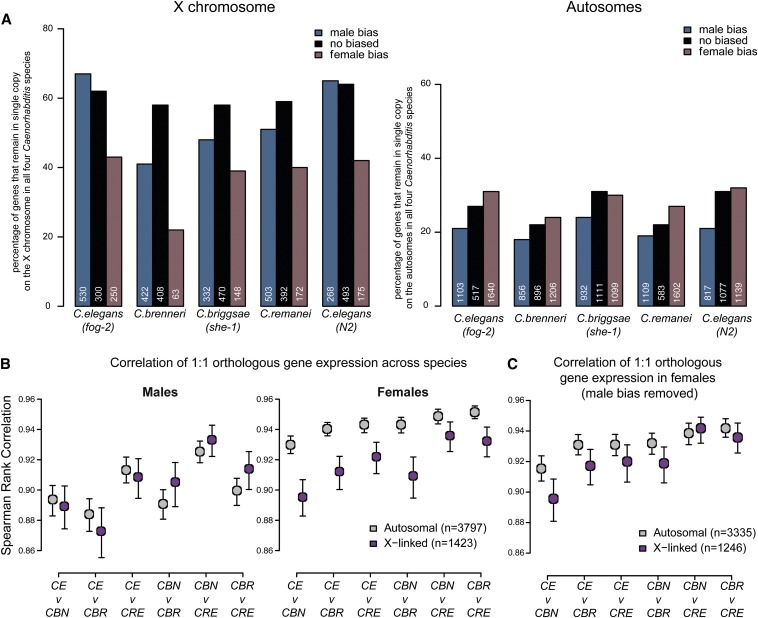
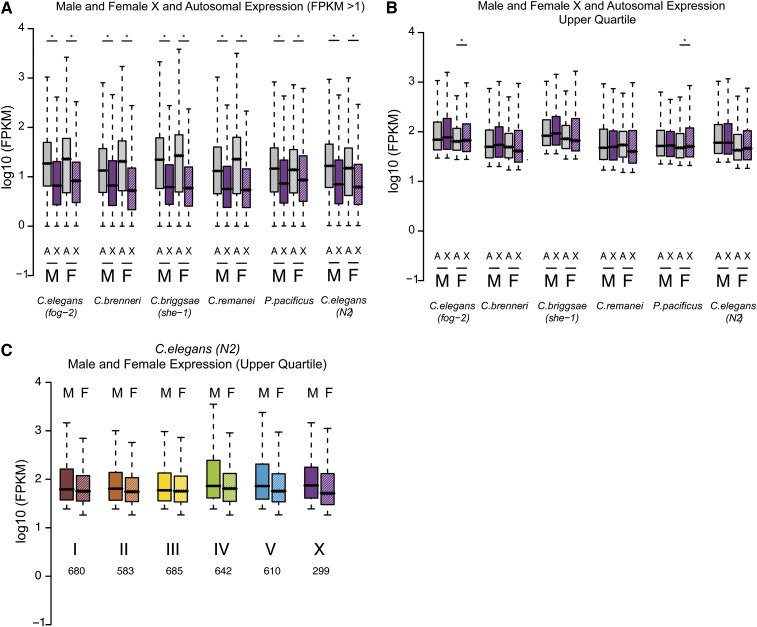
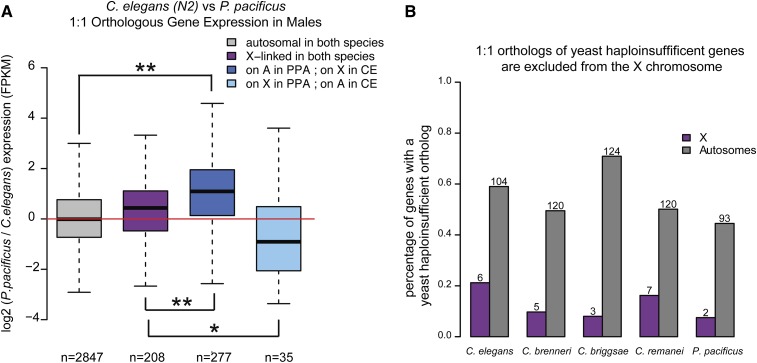
Studies of X chromosome evolution in various organisms have indicated that sex-biased genes are nonrandomly distributed between the X and autosomes. Here, to extend these studies to nematodes, we annotated and analyzed X chromosome gene content in four Caenorhabditis species and in Pristionchus pacificus. Our gene expression analyses comparing young adult male and female mRNA-seq data indicate that, in general, nematode X chromosomes are enriched for genes with high female-biased expression and depleted of genes with high male-biased expression. Genes with low sex-biased expression do not show the same trend of X chromosome enrichment and depletion. Combined with the observation that highly sex-biased genes are primarily expressed in the gonad, differential distribution of sex-biased genes reflects differences in evolutionary pressures linked to tissue-specific regulation of X chromosome transcription. Our data also indicate that X dosage imbalance between males (XO) and females (XX) is influential in shaping both expression and gene content of the X chromosome. Predicted upregulation of the single male X to match autosomal transcription (Ohno's hypothesis) is supported by our observation that overall transcript levels from the X and autosomes are similar for highly expressed genes. However, comparison of differentially located one-to-one orthologs between C. elegans and P. pacificus indicates lower expression of X-linked orthologs, arguing against X upregulation. These contradicting observations may be reconciled if X upregulation is not a global mechanism but instead acts locally on a subset of tissues and X-linked genes that are dosage sensitive.

Keywords: X chromosome evolution; dosage compensation; genomics; nematode; sex-biased gene expression.


Figures

Figure 1
Figure 1
Copy-number analysis allows for assignment of sequencing contigs to either the X or autosomes. (A) Phylogeny showing the evolutionary relationship of the five nematode species (Kiontke et al. 2004, 2011). Pristionchus pacificus is estimated to have split from Caenorhabditis ∼300 million years ago (Dieterich et al. 2006). C. briggsae, C. elegans, and P. pacificus are androgynous. C. brenneri and C. remanei are gonochoristic. Estimates of C. elegans and C. briggsae divergence times range between 40 and 80 million years. (B) Overview of the copy-number approach. DNA-seq data were generated from males (AA;XO) and females (AA;XX). Contigs were broken into 5-kb windows and male-to-female coverage ratio was evaluated for each window. (C) Plotting male-to-female coverage ratio shows clear difference between X and autosomal contigs. The log2 male-to-female coverage ratio is plotted for C. briggsae. Each point represents one 5-kb window. X chromosome (purple) and autosomal (gray) contigs are plotted along the x-axis. Contigs that could not be assigned unambiguously are plotted in black. (D) Overlap of C. briggsae copy-number assignment with WormBase assignment indicates high accuracy. (E) Overlap of P. pacificus copy-number assignment with previously reported SSCP markers (Srinivasan et al. 2002; Dieterich et al. 2006) indicates high accuracy. Chromosomal assignments by SSCP are indicated below each bar. Bars are colored to indicate copy-number assignment. Numbers above each bar indicate agreement. (F) Copy-number analysis allows for identification of a split contig in P. pacificus. The male-to-female coverage ratio of the left and right half of P. pacificus contig 10 are assigned to the X and autosome, respectively. (G) Ratio of X to autosomal gene content is roughly unchanged across species. The number of assigned genes in each category (X, purple; autosomal, gray; unassigned, green) is indicated. For each of the five species, ∼10–14% of coding genes are assigned to the X chromosome.
Figure 2
Figure 2
Distribution of the magnitude of sex bias (log2 sex expression ratio) is different for male- and female-biased genes. (A) Differential expression was determined using DESeq, q-value <0.05. Only genes with FPKM >1 in at least one sex were considered. Male and female expression was determined using cufflinks and reported as FPKM. Magnitude of sex bias was determined by taking the log2 of the sex expression ratio. For each category, male or female, genes were binned by magnitude of bias. Percentage of differentially expressed genes contained within each bin is plotted on the y-axis. (B) For C. elegans (fog-2) the magnitude of sex-biased expression is plotted against the level of expression in males (left) and females (right). Dashed line indicates FPKM = 1. Percentages of high-sex-biased genes with low expression (FPKM <1) in the opposite sex are indicated. Nonbiased genes are plotted in black. Male-biased genes are plotted in blue; female-biased genes are plotted in pink. Darker colors indicate high magnitude of bias. R2 values between magnitude of bias and expression levels are indicated for each category.
Figure 3
Figure 3
Majority of sex-biased genes are male biased. High magnitude of sex bias is linked to gonadal expression. (A) For C. elegans (N2), male (x-axis) and female (y-axis) expression values (log10 FPKM) are plotted. (B) There is a greater tendency toward male bias in all five species. Number of genes with male (blue) and female (pink) biased expression is plotted for each species. (C) Genes expressed in the gonad show higher magnitude of sex-biased expression. Lists of genes with gonadal and somatic expression were taken from Spencer et al. (2011). Histogram shows the frequency of the magnitude of sex bias for gonad-only (dark green), soma-only (light green), and gonad and soma-expressed (gray) genes. Number of genes in each category is indicated. Red line indicates log2 expression ratio of 3. (D) Distribution of magnitude of sex bias for P. pacificus and C. elegans YA worms. Absolute value of the log2 sex expression ratio was calculated for all sex-biased genes. Histogram shows the frequency of the magnitude of sex bias for C. elegans (light gray) and P. pacificus (dark gray).
Figure 4
Figure 4
Sex-biased genes are nonrandomly distributed between the X and autosomes. (A) Genes for each species were placed into one of seven categories: all genes, male-specific, high male bias, low male bias, low female bias, high female bias, or female specific (see Materials and Methods). For each category, percentage of X-linked genes is plotted. Number of X-linked genes is indicated below each bar. Significance of enrichment or depletion was calculated using Fisher test: (*)P-value <0.05; (**)P-value <0.001. (B) For C. elegans (fog-2), expression levels of sex-biased genes in each category are plotted. Male expression is plotted for male-biased genes (left three boxes) and female expression is plotted for female-biased genes (right three boxes). (C) Magnitude of male-biased expression (log2 male over female expression) was calculated for each high-male-biased gene. X-linked genes are plotted in purple; autosomal genes are plotted in gray. Number of genes analyzed is indicated below each box. High-male-biased genes located on autosomes showed significantly greater magnitude of sex bias compared to those located on the X chromosome as calculated by t-test: (*)P-value <0.01. (D) As in C, magnitude of female-biased expression (log2 female over male expression) was calculated for each high female-biased gene.
Figure 5
Figure 5
Evolution of hermaphroditism is linked to the preferential loss of autosomal-linked highly male-biased genes. (A) Gonochoristic-specific genes are enriched for genes with high male bias. Gonochoristic-specific genes were identified by taking the overlap of genes that had an ortholog in each of three gonochoristic species (C. brenneri, C. remanei, and C. japonica), but lacked an ortholog in two hermaphroditic species (C. elegans and C. briggsae). For C. brenneri (dark gray) and C. remanei (light gray), the percentage of gonochoristic-specific genes that are X linked, show high male bias, or show high female bias is plotted. The number of genes identified in each category is indicated in each bar. Significance of enrichment or depletion was calculated using Fisher test: (*)P-value <0.05; (**)P-value <0.001. From left to right: purple, blue, and pink lines demark the genome-wide percentage of X-linked, high-male-biased, and high-female-biased genes for C. brenneri and C. remanei respectively. (B) Gonochoristic-specific genes with high male bias are underrepresented on the X chromosome. Plotted is the percentage of high male-bias genes that are X linked. Gonochoristic-specific genes are plotted in dark gray. Numbers below each bar indicates the number of genes that are in each category. Significance of depletion was calculated using Fisher test.
Figure 6
Figure 6
Conservation of orthologous gene expression across species. (A) On the X, male-biased genes are more likely to be conserved than female-biased genes. For each species, genes were divided into three categories: male-biased (blue), female-biased (purple), and nonbiased (black). Within each category, we identified 1:1:1:1 Caenorhabditis orthologs that are located on the same chromosome (X, left) or autosome (right) in all four species. X-linked genes have a higher tendency than autosomal genes to remain on the same chromosome and in single copy. Similarly, X-linked male-biased genes show greater tendency to remain in single copy compared to X-linked female-biased genes. (B) Correlation of 1:1 orthologous gene expression between Caenorhabditis indicates that X-linked expression is evolving faster in females. Between any two species, Spearman rank correlation of 1:1 orthologous gene expression was plotted for males (left) and females (right). As determined by bootstrapping, 95% confidence intervals are indicated. (CE, C. elegans; CBN, C. brenneri; CBR, C. briggsae; CRE, C. remanei). (C) High male-biased genes are removed from correlation analysis shown in B, right.
Figure 7
Figure 7
Analysis of overall expression levels from the X chromosome and autosomes. (A) Expression level of genes with FPKM >1 is plotted. X-linked genes are shown in purple. Autosomal genes are in gray. Male expression data are plotted in solid bars. Female data are in dashed bars. As measured in young adults, X expression is significantly lower than autosomal expression. (*)P-value <0.01 by t-test. (B) Genes whose expression is in the upper quartile in both males and females are plotted (at least 225 X-linked and 2890 autosomal-linked genes). X and autosomal expression is similar except in C. brenneri and C. remanei, where female X expression is significantly lower than autosomal expression. (*)P-value <0.01 by t-test. (C) C. elegans (fog-2) expression values plotted for each chromosome separately. Analysis is limited to the upper quartile genes. Number of genes analyzed is indicated below each bar.
Figure 8
Figure 8
Monosomy of the male X results in lower expression of X-linked orthologs in males. (A) Comparison of gene expression between C. elegans and P. pacificus indicates higher expression of the autosomal ortholog. Log2 male expression ratio (P. pacificus/C. elegans) is plotted for four groups of genes: autosomal in both species (gray), X-linked in both species (purple), autosomal in P. pacificus and X in C. elegans (dark blue), X in P. pacificus and autosomal in C. elegans (light blue). Number of genes in each category is indicated below each bar. (B) Haplo-insufficient genes are excluded from the X chromosome. Orthologs of yeast haplo-insifficient genes were identified in each of the five species (Table S7). The percentage of orthologs that are on X (purple) and autosomes (gray) is plotted. Numbers above each bar indicate the number of haplo-insufficient 1:1 orthologs identified.

References

    1. Adler D. A., Rugarli E. I., Lingenfelter P. A., Tsuchiya K., Poslinski D., et al. , 1997. Evidence of evolutionary up-regulation of the single active X chromosome in mammals based on Clc4 expression levels in Mus spretus and Mus musculus. Proc. Natl. Acad. Sci. USA 94: 9244–9248. - PMC - PubMed
    1. Allen S. L., Bonduriansky R., Chenoweth S. F., 2013. The genomic distribution of sex-biased genes in Drosophila serrata: X chromosome demasculinization, feminization, and hyperexpression in both sexes. Genome Biol. Evol. 5: 1986–1994. - PMC - PubMed
    1. Altenhoff A. M., and Dessimoz C., 2009. Phylogenetic and functional assessment of orthologs inference projects and methods. PLOS Comput. Biol. 5: e1000262. - PMC - PubMed
    1. Anders S., and Huber W., 2010. Differential expression analysis for sequence count data. Genome Biol. 11: R106. - PMC - PubMed
    1. Arnqvist G., 2004. Sexual conflict and sexual selection: lost in the chase. Evolution 58: 1383–1393. - PubMed

Publication types

Associated data