

Spin equilibrium and O₂-binding kinetics of Mycobacterium tuberculosis CYP51 with mutations in the histidine-threonine dyad
- PMID: 24793591
- PMCID: PMC4085784
- DOI: 10.1016/j.jinorgbio.2014.03.017
Spin equilibrium and O₂-binding kinetics of Mycobacterium tuberculosis CYP51 with mutations in the histidine-threonine dyad
Abstract
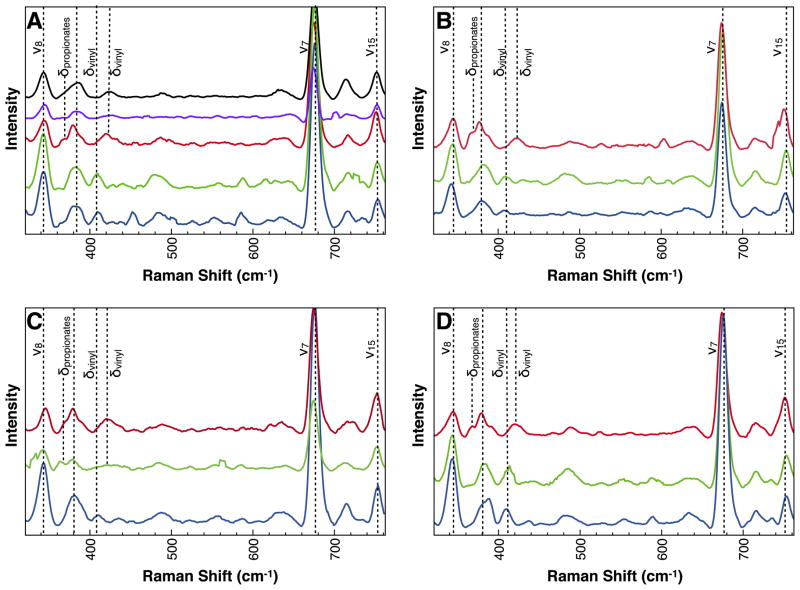
The acidic residues of the "acid-alcohol pair" in CYP51 enzymes are uniformly replaced with histidine. Herein, we adopt the Mycobacterium tuberculosis (mt) enzyme as a model system to investigate these residues' roles in finely tuning the heme conformation, iron spin state, and formation and decay of the oxyferrous enzyme. Properties of the mtCYP51 and the T260A, T260V, and H259A mutants were interrogated using UV-Vis and resonance Raman spectroscopies. Evidence supports that these mutations induce comprehensive changes in the heme environment. The heme iron spin states are differentially sensitive to the binding of the substrate, dihydrolanosterol (DHL). DHL and clotrimazole perturb the local environments of the heme vinyl and propionate substituents. Molecular dynamics (MD) simulations of the DHL-enzyme complexes support that the observed perturbations are attributable to changes in the DHL binding mode. Furthermore, the rates of the oxyferrous formation were measured using stopped-flow methods. These studies demonstrate that both HT mutations and DHL modulate the rates of oxyferrous formation. Paradoxically, the binding rate to the H259A mutant-DHL complex was approximately four-fold that of mtCYP51, a phenomenon that is predicted to result from the creation of an additional diffusion channel from loss of the H259-E173 ion pair in the mutant. Oxyferrous enzyme auto-oxidation rates were relatively constant, with the exception of the T260V-DHL complex. MD simulations lead us to speculate that this behavior may be attributed to the distortion of the heme macrocycle by the substrate.
Keywords: CYP51; Cytochrome P450; Molecular dynamics; Resonance Raman spectroscopy; Stopped-flow spectroscopy.
Copyright © 2014 Elsevier Inc. All rights reserved.
Figures


Similar articles
-
Biophysical characterization of the sterol demethylase P450 from Mycobacterium tuberculosis, its cognate ferredoxin, and their interactions.Biochemistry. 2006 Jul 11;45(27):8427-43. doi: 10.1021/bi0601609. Biochemistry. 2006. PMID: 16819841
-
Conservation in the CYP51 family. Role of the B' helix/BC loop and helices F and G in enzymatic function.Biochemistry. 2003 Aug 5;42(30):9091-101. doi: 10.1021/bi034663f. Biochemistry. 2003. PMID: 12885242
-
A comparison of the bacterial CYP51 cytochrome P450 enzymes from Mycobacterium marinum and Mycobacterium tuberculosis.J Steroid Biochem Mol Biol. 2022 Jul;221:106097. doi: 10.1016/j.jsbmb.2022.106097. Epub 2022 Mar 25. J Steroid Biochem Mol Biol. 2022. PMID: 35346833
-
CYP121, CYP51 and associated redox systems in Mycobacterium tuberculosis: towards deconvoluting enzymology of P450 systems in a human pathogen.Biochem Soc Trans. 2006 Dec;34(Pt 6):1178-82. doi: 10.1042/BST0341178. Biochem Soc Trans. 2006. PMID: 17073780 Review.
-
CYP51--the omnipotent P450.Mol Cell Endocrinol. 2004 Feb 27;215(1-2):165-70. doi: 10.1016/j.mce.2003.11.016. Mol Cell Endocrinol. 2004. PMID: 15026190 Review.
Cited by
-
Spectroscopic studies of the cytochrome P450 reaction mechanisms.Biochim Biophys Acta Proteins Proteom. 2018 Jan;1866(1):178-204. doi: 10.1016/j.bbapap.2017.06.021. Epub 2017 Jun 28. Biochim Biophys Acta Proteins Proteom. 2018. PMID: 28668640 Free PMC article. Review.
-
Revealing substrate-induced structural changes in active site of human CYP51 in the presence of its physiological substrates.J Inorg Biochem. 2023 May;242:112167. doi: 10.1016/j.jinorgbio.2023.112167. Epub 2023 Feb 26. J Inorg Biochem. 2023. PMID: 36870163 Free PMC article.
-
The use of isomeric testosterone dimers to explore allosteric effects in substrate binding to cytochrome P450 CYP3A4.J Inorg Biochem. 2016 May;158:77-85. doi: 10.1016/j.jinorgbio.2015.12.019. Epub 2015 Dec 31. J Inorg Biochem. 2016. PMID: 26774838 Free PMC article.
References
-
- Sono M, Roach MP, Coulter ED, Dawson JH. Chem Rev. 1996;96:2841–2888. - PubMed
-
- Meunier B, de Visser SP, Shaik S. Chem Rev. 2004;104:3947–3980. - PubMed
-
- Denisov IG, Makris TM, Sligar SG, Schlichting I. Chem Rev. 2005;105:2253–2277. - PubMed
-
- Guengerich FP. Curr Drug Metab. 2001;2:93–115. - PubMed
-
- Ortiz de Montellano PR. Cytochrome P450: structure, mechanism, and biochemistry. Vol. 3. Kluwer Academic/Plenum Publishers; New York: 2005.
Publication types
MeSH terms
Substances
Grants and funding
LinkOut - more resources
Full Text Sources
Other Literature Sources
