. 2014 Jun 5;54(5):766-76.
doi: 10.1016/j.molcel.2014.03.045. Epub 2014 May 1.

Assessing the ceRNA hypothesis with quantitative measurements of miRNA and target abundance

Affiliations

Assessing the ceRNA hypothesis with quantitative measurements of miRNA and target abundance

Rémy Denzler et al. Mol Cell. .

Abstract

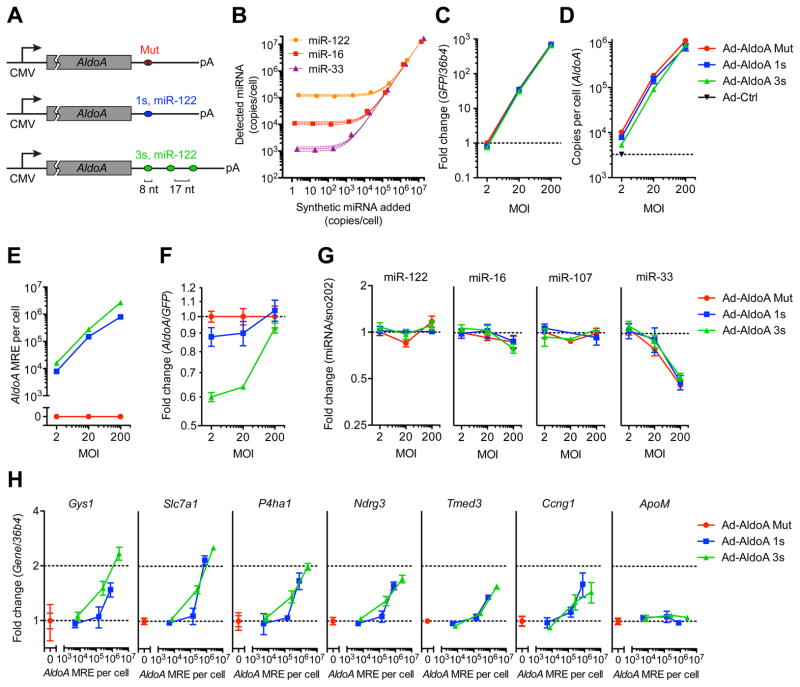
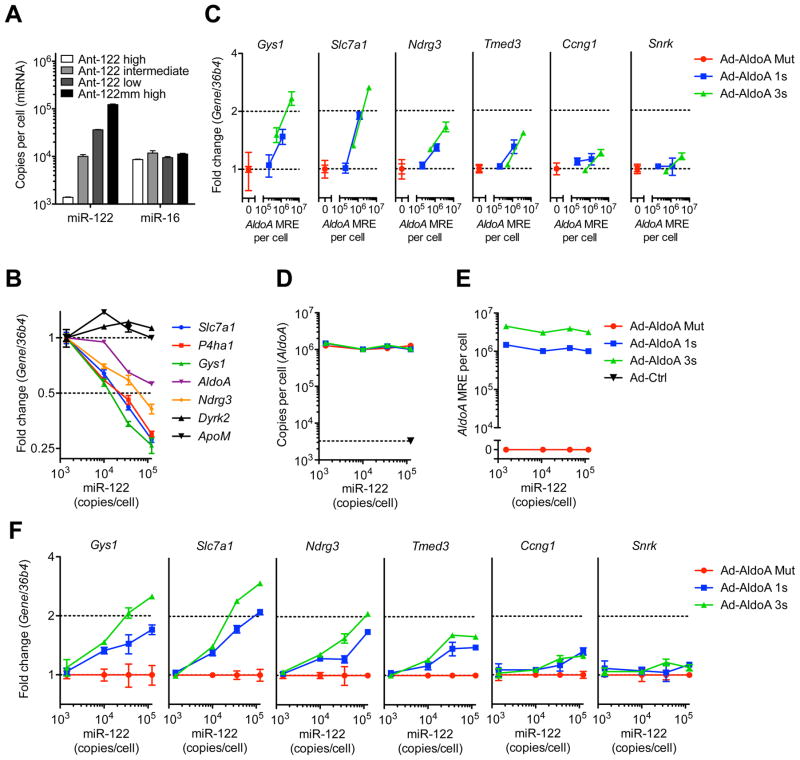
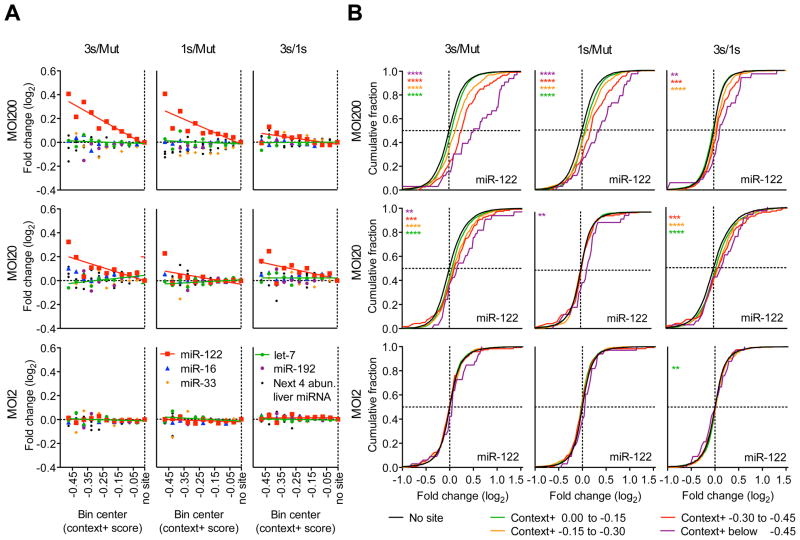
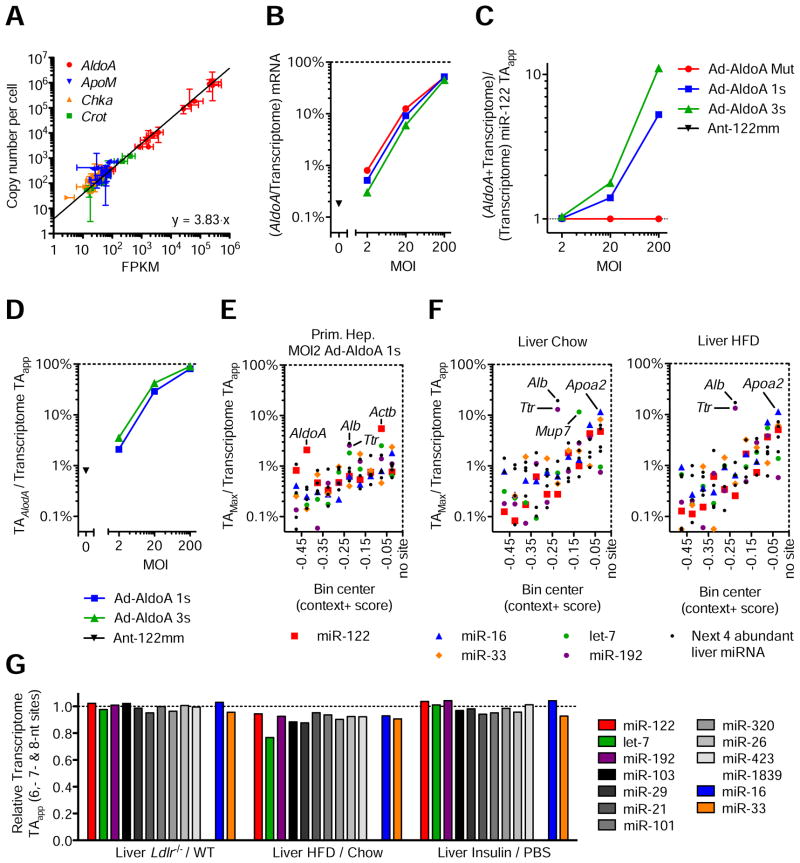
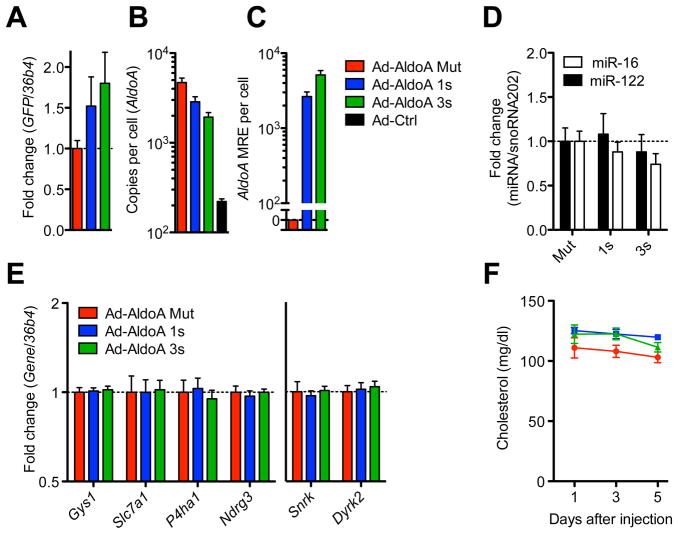
Recent studies have reported that competitive endogenous RNAs (ceRNAs) can act as sponges for a microRNA (miRNA) through their binding sites and that changes in ceRNA abundances from individual genes can modulate the activity of miRNAs. Consideration of this hypothesis would benefit from knowing the quantitative relationship between a miRNA and its endogenous target sites. Here, we altered intracellular target site abundance through expression of an miR-122 target in hepatocytes and livers and analyzed the effects on miR-122 target genes. Target repression was released in a threshold-like manner at high target site abundance (≥1.5 × 10(5) added target sites per cell), and this threshold was insensitive to the effective levels of the miRNA. Furthermore, in response to extreme metabolic liver disease models, global target site abundance of hepatocytes did not change sufficiently to affect miRNA-mediated repression. Thus, modulation of miRNA target abundance is unlikely to cause significant effects on gene expression and metabolism through a ceRNA effect.


Figures

Figure 1
Figure 1. miRNA target derepression is detected at a high threshold of added MREs
(A) Schematic overview of the different AldoA-expressing adenovirus constructs (Ad-AldoA) harboring either one (1s, blue) or three (3s, green) miR-122 binding sites, or a mutated site (Mut, red). Ad-AldoA 3s contained three 8-nt seed matches of miR-122 separated by 17-nt spacers. See also Figure S1. (B) Absolute miRNA quantification of primary hepatocyte cell lysates spiked with different amounts of synthetic miRNA. Solid lines represent linear regression data with respective 95% confidence intervals. (C H) Primary hepatocytes infected with different multiplicities of infection (MOI) of the Ad-AldoA constructs. Relative gene expression of GFP (C) and AldoA (F), absolute copy numbers per cell of AldoA (D) and AldoA MRE (E). Relative expression of miRNAs (G), or miR-122 target genes and a control non-target gene (ApoM) (H). See also Figure S2. GFP and miRNA expression are relative to Ad-AldoA Mut at MOI 2; AldoA, miR-122 target genes and the control gene are relative to the respective Ad-AldoA Mut at given MOI. Data represent mean ± SEM (n = 3) for all panels.
Figure 2
Figure 2. The high threshold persists after lowering miR-122 activity
(A) Absolute miRNA copy numbers per cell, or (B) relative expression of miR-122 target genes and control non-target genes (Dyrk2 and ApoM) in primary hepatocytes from mice treated with Ant-122mm or different concentrations of Ant-122. Values for miR-122 target and control genes are normalized to that of the lowest miR-122 concentration. (C) Relative expression of miR-122 target genes and a non-target gene (Snrk) in primary hepatocytes with 3-fold decreased miR-122 levels shown in (A), infected with MOI 20 and 200 of Ad-AldoA Mut (red), 1s (blue) or 3s (green). (D–F) Primary hepatocytes shown in (A) infected with MOI 200 of the three Ad-AldoA constructs. Absolute copy numbers per cell of AldoA (D) and AldoA MRE (E) in relation to miR-122 copy numbers. (F) Relative expression of miR-122 target genes and control non-target gene (Snrk), normalized to Ad-AldoA Mut of the respective miR-122 condition. Absolute miRNA copy numbers were calculated by multiplying relative abundance (miRNA/snoRNA202) that were normalized to Ant-122mm with the copy number evaluated in Figure 1B. Data represent mean ± SEM (n = 4) for all panels.
Figure 3
Figure 3. The magnitude of derepression correlates with predicted site efficacy and number of added AldoA MREs
(A–B) RNA-seq results showing derepression of predicted targets from primary hepatocytes infected with MOI 200, 20, and 2 of Ad-AldoA Mut, 1s, or 3s shown in Figure 1C–H. (A) Predicted targets of miR-122 (red), miR-16 (blue), miR-33 (orange), let-7 (green), miR-192 (purple), or a combination of the next four most abundant liver miRNA families (black) were grouped into ten bins based on their context+ scores. For each miRNA family, the median log2-fold change is plotted for the predicted targets in each bin. Medians were normalized to that of the bin with genes without sites. Bins each had at least 10 genes; see Figure S3B for group sizes. (B) Cumulative distributions of mRNA changes for genes with no miR-122 site (black) or predicted target genes with the indicated context+ score bins (color). Number of genes per bin: black, 6629; green, 1693; orange, 434; red, 120; purple, 33. *P < 0.05, **P < 0.01, ***P < 0.001, ****, P < 0.0001, one-sided Kolmogorov–Smirnov (K–S) test. See also Figure S3 and Table S1.
Figure 4
Figure 4. Modest changes in target abundance are induced by metabolic stress and disease
(A) Relationship between FPKM from RNA-seq data and absolute quantification using qPCR. Represented are four genes quantified in all 11 primary hepatocyte samples, plus wildtype and Ldlr−/−liver samples. Line represents linear regression of data points. Data represent mean ± 95% confidence intervals. (B–D) RNA-seq data from primary hepatocytes infected with MOI 200, 20, and 2 of Ad-AldoA Mut, 1s, or 3s shown in Figure 1C–H. Data represent mean ± SEM. (B) Contribution of AldoA mRNA to the sum of genome mRNA. (C) Increase of transcriptome miR-122 TAapp (D) and the respective contribution of AldoA MRE to total transcriptome miR-122 TAapp mediated by the different Ad-AldoA constructs and viral concentrations. (E–F) Fractional contribution of the largest potential contributors to transcriptome TAapp in primary hepatocytes infected with MOI 2 of Ad-AldoA 1s (E) or in wildtype livers (F) originated from mice either fed normal chow or high-fat diet (HFD). Potential contributors were binned by their context+ score, and the top potential contributors are plotted within each bin. See also Figure S4 and Table S2. (G) Relative target abundance of livers from models of physiological (Insulin) or disease/stress states (Ldlr−/−and HFD).
Figure 5
Figure 5. No ceRNA effect is detected in vivo
(A E) Mice were injected with Ad-AldoA Mut (red, n = 6), 1s (blue, n = 6), or 3s (green, n = 5) and gene expression analysis was performed 5 days post infection. Relative gene expression of GFP (A), absolute copy numbers per cell of AldoA (B), and added AldoA MREs (C). Relative expression of miRNAs (D) and miR-122 target genes or control non-target genes (Snrk and Dyrk2) (E). (F) Plasma cholesterol levels of Ad-AldoA-treated mice at day 1, 3, and 5. The Ad-AldoA used in this experiment expressed the full-length protein. Data represent mean ± SEM.

Comment in

Similar articles

Cited by

References

    1. Ala U, Karreth FA, Bosia C, Pagnani A, Taulli R, Leopold V, Tay Y, Provero P, Zecchina R, Pandolfi PP. Integrated transcriptional and competitive endogenous RNA networks are cross-regulated in permissive molecular environments. Proc Natl Acad Sci U S A. 2013;110:7154–7159. - PMC - PubMed
    1. Ameres SL, Horwich MD, Hung JH, Xu J, Ghildiyal M, Weng Z, Zamore PD. Target RNA-directed trimming and tailing of small silencing RNAs. Science. 2010;328:1534–1539. - PMC - PubMed
    1. Arvey A, Larsson E, Sander C, Leslie CS, Marks DS. Target mRNA abundance dilutes microRNA and siRNA activity. Molecular systems biology. 2010;6:363. - PMC - PubMed
    1. Baek D, Villen J, Shin C, Camargo FD, Gygi SP, Bartel DP. The impact of microRNAs on protein output. Nature. 2008;455:64–71. - PMC - PubMed
    1. Bissels U, Wild S, Tomiuk S, Holste A, Hafner M, Tuschl T, Bosio A. Absolute quantification of microRNAs by using a universal reference. Rna. 2009;15:2375–2384. - PMC - PubMed

Publication types

Associated data