. 2014 Aug;24(8):715-27.
doi: 10.1093/glycob/cwu035. Epub 2014 May 2.

Endothelial and leukocyte heparan sulfates regulate the development of allergen-induced airway remodeling in a mouse model

Affiliations

Endothelial and leukocyte heparan sulfates regulate the development of allergen-induced airway remodeling in a mouse model

Xiao Na Ge et al. Glycobiology. 2014 Aug.

Abstract

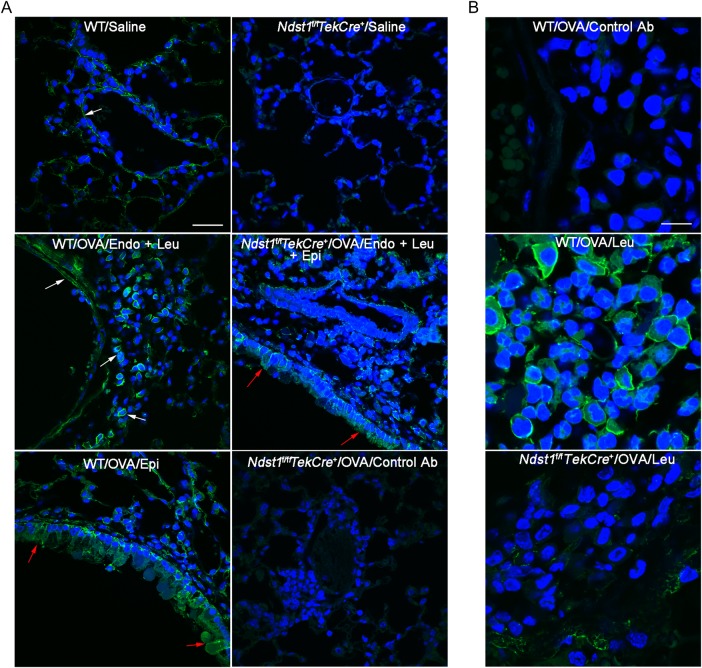
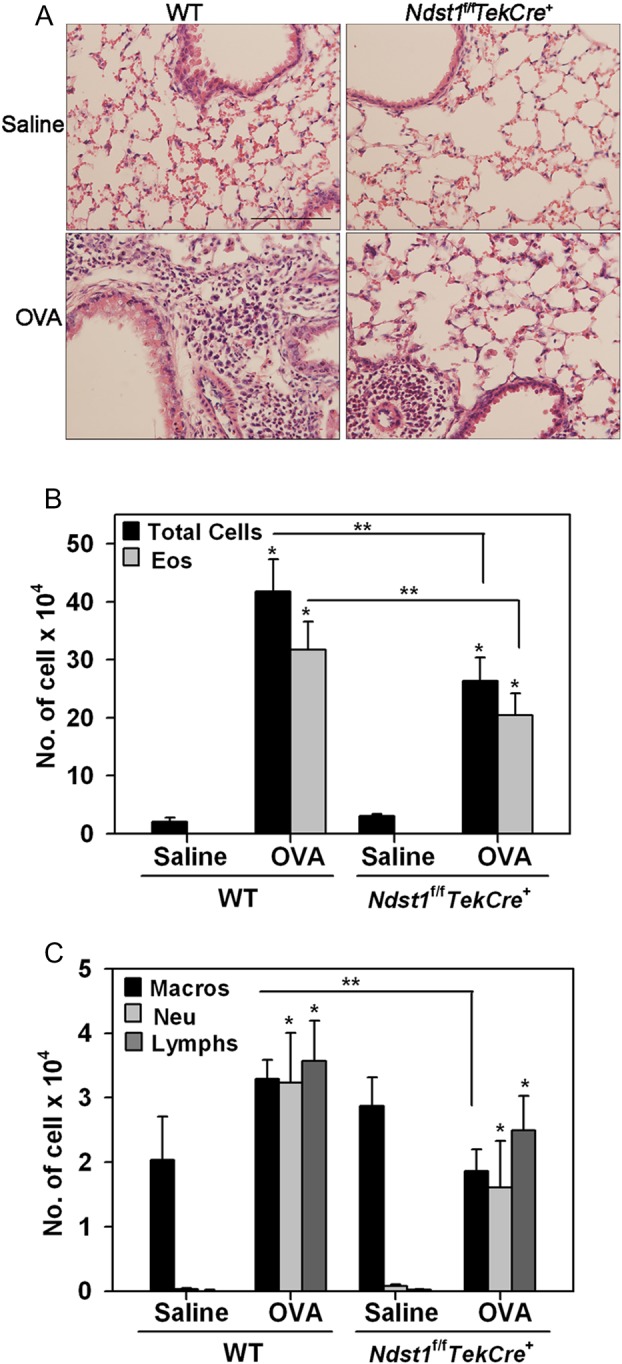
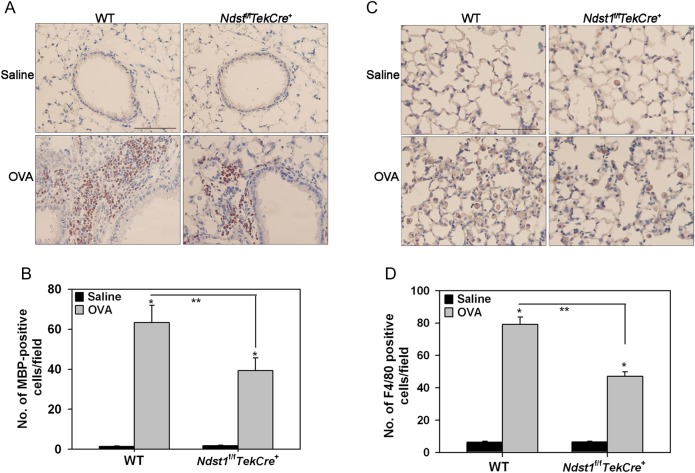
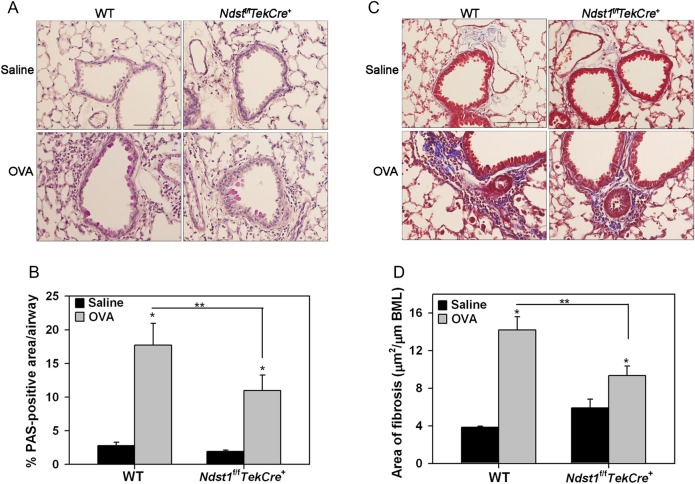
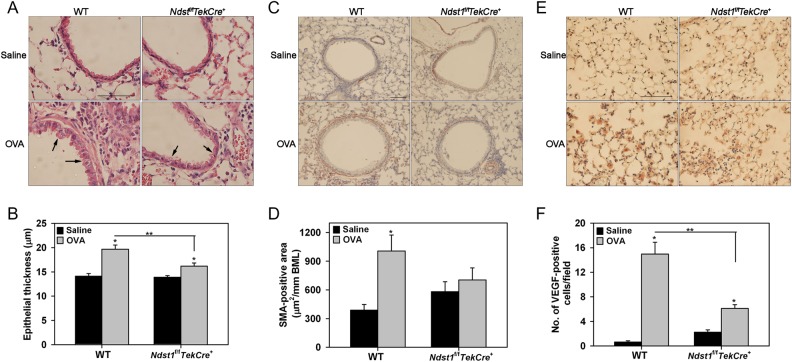
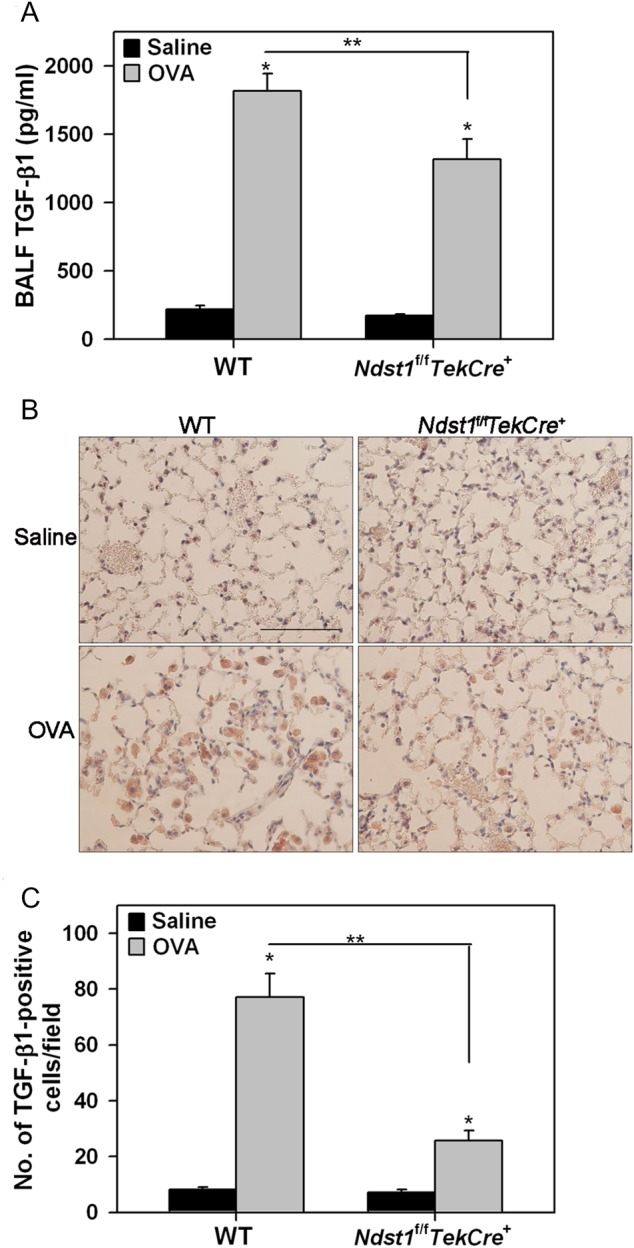
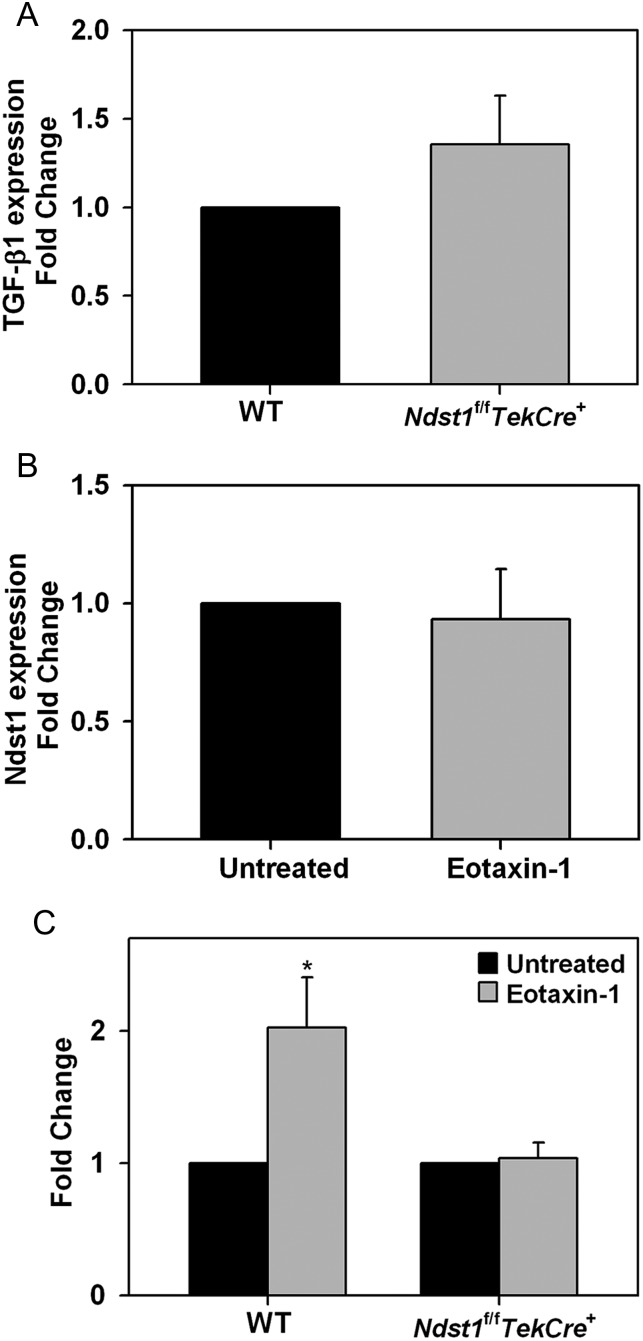
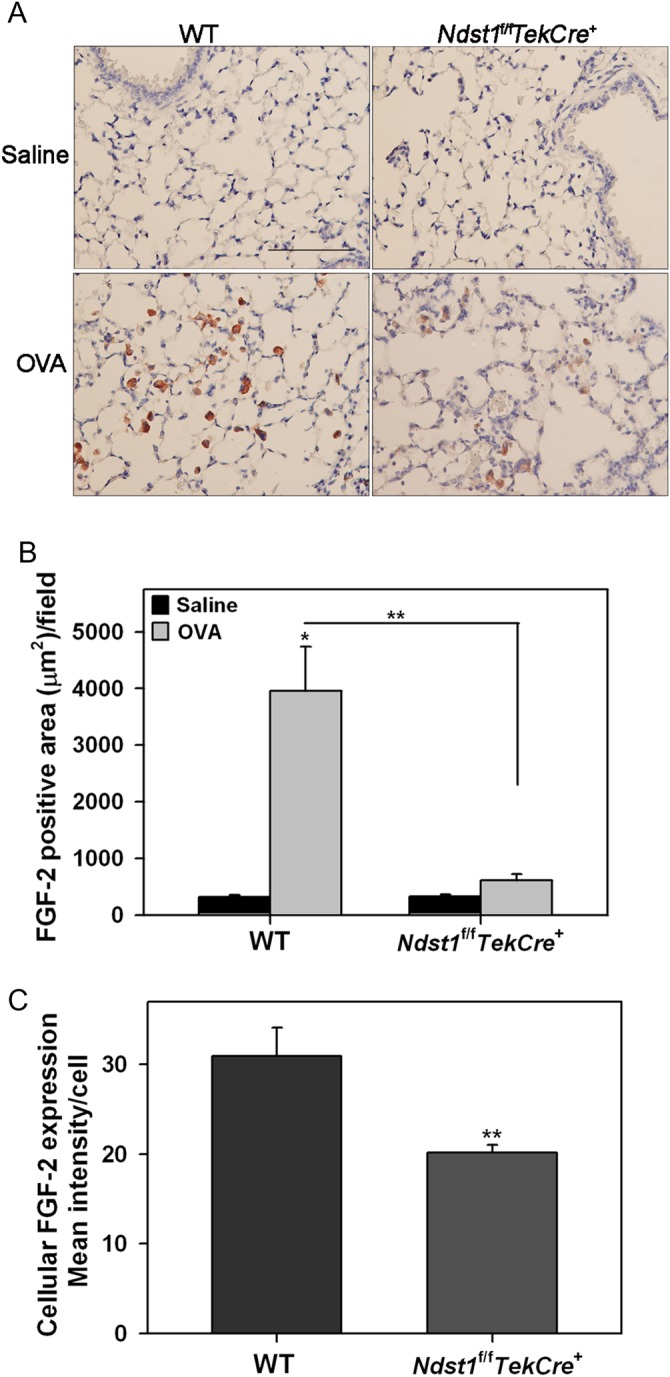
Heparan sulfate (HS) proteoglycans (HSPGs) participate in several aspects of inflammation because of their ability to bind to growth factors, chemokines, interleukins and extracellular matrix proteins as well as promote inflammatory cell trafficking and migration. We investigated whether HSPGs play a role in the development of airway remodeling during chronic allergic asthma using mice deficient in endothelial- and leukocyte-expressed N-deacetylase/N-sulfotransferase-1 (Ndst1), an enzyme involved in modification reactions during HS biosynthesis. Ndst1-deficient and wild-type (WT) mice exposed to repetitive allergen (ovalbumin [OVA]) challenge were evaluated for the development of airway remodeling. Chronic OVA-challenged WT mice exhibited increased HS expression in the lungs along with airway eosinophilia, mucus hypersecretion, peribronchial fibrosis, increased airway epithelial thickness and smooth muscle mass. In OVA-challenged Ndst1-deficient mice, lung eosinophil and macrophage infiltration as well as airway mucus accumulation, peribronchial fibrosis and airway epithelial thickness were significantly lower than in allergen-challenged WT mice along with a trend toward decreased airway smooth muscle mass. Leukocyte and endothelial Ndst 1 deficiency also resulted in significantly decreased expression of IL-13 as well as remodeling-associated mediators such as VEGF, FGF-2 and TGF-β1 in the lung tissue. At a cellular level, exposure to eotaxin-1 failed to induce TGF-β1 expression by Ndst1-deficient eosinophils relative to WT eosinophils. These studies suggest that leukocyte and endothelial Ndst1-modified HS contribute to the development of allergen-induced airway remodeling by promoting recruitment of inflammatory cells as well as regulating expression of pro-remodeling factors such as IL-13, VEGF, TGF-β1 and FGF-2 in the lung.

Keywords: FGF-2; N-Deacetylase/N-Sulfotransferase-1; TGF-β; allergen-induced airway remodeling; heparan sulfates.


Figures

Fig. 1.
Fig. 1.
Lung HS expression after allergen exposure. (A) Expression of sulfated PG in lungs of control and repetitively OVA-challenged WT and Ndst1f/fTekCre+ mice examined by immunofluorescence staining with VSV-tagged phage display-derived single chain antibody AO4B08 that interacts with the N-, 2-O-, and 6-O-sulfated saccharide motif as well as an internal 2-O-sulfate group. A non-GAG binding antibody MPB49 was used as a control. White arrows indicate positive (bright green) staining in the endothelium (Endo) and leukocytes (Leu). Red arrows indicate positive staining in the airway epithelium (Epi). Staining with a control antibody MPB49 in OVA-challenged Ndst1f/fTekCre+ mice is shown. Scale bar represents 30 μm. (B) Expression of sulfated PG by leukocytes recruited to the lungs of OVA-challenged WT and Ndst1f/fTekCre+ mice by immunofluorescence staining with antibody AO4B08. Staining with antibody MPB49 is shown as the control. Scale bar represents 10 μm. Representative data of n = 3 mice/group is shown.
Fig. 2.
Fig. 2.
Reduced cellular infiltration of the airways in allergen-exposed Ndst1f/fTekCre+ mice. Lung tissue and BALF was collected from control and allergen-challenged WT and Ndst1f/fTekCre+ mice 24 h after the last challenge. (A) Cellular infiltration was evaluated by H&E staining of paraformaldehyde-fixed paraffin embedded lung tissue sections. Images representative of each group are shown. Scale bar represents 100 μm. (B and C) BALF was evaluated for total as well as differential cell counts by microscopic evaluation of cytocentrifuged slides based on morphological criteria after Hema 3 staining. Total and eosinophil [Eos] counts are shown in B; macrophage [Macros], neutrophil [Neu], and lymphocyte [Lymphs] counts are shown in C. Data represent mean ± SEM. Combined data of n = 5 mice for control groups and 7–8 mice for allergen-challenged groups is shown in B and C. *P < 0.01 in B and <0.04 in C for comparison of control vs. allergen-exposed mice. **P < 0.05 in B and C for comparison of allergen-challenged groups.
Fig. 3.
Fig. 3.
Reduced tissue eosinophils and macrophages in allergen-exposed Ndst1f/fTekCre+ mice. Lung tissue from control and allergen-exposed WT and Ndst1f/fTekCre+ mice was evaluated for eosinophils and macrophages by immunohistochemical staining. (A) Eosinophils were identified with eosinophil-specific MBP using rat mAb against murine MBP. A representative image of lung sections from each group is shown. (B) MBP-positive cells in randomly selected non-overlapping microscopic fields of lung tissue (5 fields/mouse for control group and 17 ± 2 [Mean ± STD] fields/mouse for allergen-exposed groups) were counted at a magnification of ×400. (C) Lung tissue macrophages were identified with rat anti-mouse F4/80. A representative image of lung sections from each group is shown. (D) The number of F4/80-positive cells in randomly selected non-overlapping microscopic fields (10 fields/mouse) of the alveolar tissue was counted at a magnification of ×400. Scale bar in A and C represents 100 μm. Combined data (Mean ± SEM) of n = 5–6 mice/group is shown in B and D. *P < 0.01 in for comparison of control vs. allergen-exposed mice and **P < 0.02 for comparison of allergen-challenged groups.
Fig. 4.
Fig. 4.
Decreased airway mucus secretion and peribronchial fibrosis in allergen-exposed Ndst1f/fTekCre+ mice. (A and B) Airway mucus secretion in control and allergen-challenged WT and Ndst1f/fTekCre+ mice was examined by PAS staining of lung sections. Images representative of each group are shown. PAS-positive area in airways (5–8 airways/mouse) was quantitated by ImageJ analysis of captured images. (C and D) Peribronchial fibrosis around airways was examined by staining lung sections with Masson's trichrome stain for collagen deposition. Images representative of each group are shown. Fibrotic area was quantitated (2–13 airways/mouse with similar basement membrane length of 660 ± 20 μm) by image analysis using ImageJ. Scale bar in A and C represents 100 μm. Combined data (Mean ± SEM) of n = 5–6 mice/group is shown. *P < 0.01 for comparison of control vs. allergen-exposed mice in B and D and **P < 0.05 in B and <0.01 in D for comparison of allergen-challenged groups.
Fig. 5.
Fig. 5.
Epithelial thickness, smooth muscle mass and expression of VEGF is decreased in allergen-challenged Ndst1f/fTekCre+ mice. (A and B) Epithelial thickness in all intact airways was measured in H&E-stained lung sections from control (25–27 airways) and allergen-exposed (32–42 airways) WT and Ndst1f/fTekCre+ mice using ImageJ. Images representative of each group are shown. Arrows indicate the airway epithelium in OVA-challenged WT and Ndst1f/fTekCre+ mice. Scale bar represents 50 μm. (C and D) Airway smooth muscle mass in lung sections from control and allergen-exposed WT and Ndst1f/fTekCre+ mice was examined by immunohistochemical staining for α-SMA. Images representative of each group are shown. Peribronchial smooth muscle mass was quantitated (2–14 airways/mouse with similar basement membrane length of 714 ± 20 μm) by image analysis using ImageJ. Scale bar represents 100 μm. (E and F) VEGF expression by inflammatory cells in lung tissue from control and OVA-challenged WT and Ndst1f/fTekCre+ mice was detected by immunohistochemistry with polyclonal antibodies against VEGF. The number of VEGF-positive cells in randomly selected non-overlapping microscopic fields (5 fields/mouse) of the alveolar tissue in lung sections was counted at a magnification of ×400. Representative images are shown for each group. Scale bar represents 100 μm. Combined data (Mean ± SEM) of n = 5–6 mice/group is shown. *P < 0.01 for comparison of control vs. allergen-exposed mice in B, D and F, and **P < 0.01 for comparison of allergen-challenged groups in B and F.
Fig. 6.
Fig. 6.
Lung TGF-β1 expression is reduced in allergen-challenged Ndst1f/fTekCre+ mice. (A) TGF-β1 in BALF from control (5–6 mice/group) and allergen-exposed (7–8 mice/group) WT and Ndst1f/fTekCre+ mice was determined by ELISA. (B) TGF-β1 expression in lung tissue of these mice was detected by immunohistochemistry with polyclonal antibodies against TGF-β1. Images representative of each group are shown. Scale bar represents 100 μm. (C) The number of TGF-β1-positive cells in randomly selected non-overlapping microscopic fields (5 fields/mouse) of the alveolar tissue in lung sections from control and allergen-exposed mice (n = 5–6 mice/group) were counted at a magnification of ×400. Data represents mean ± SEM. *P < 0.01 in A and C for comparison of control vs. allergen-exposed mice. **P < 0.02 in A and C for comparison of allergen-challenged groups.
Fig. 7.
Fig. 7.
Expression of TGF-β1 by eosinophils from WT and Ndst1f/fTekCre+ mice. (A) Expression of TGF-β1 in unstimulated eosinophils cultured from BM of WT and Ndst1f/fTekCre+ mice by qPCR. (B) Expression of Ndst1 mRNA by eosinophils from WT mice with and without activation (100 nM eotaxin-1 for ∼16 h). (C) Expression of TGF-1 mRNA by eosinophils from WT and Ndst1f/fTekCre+ mice with and without activation with eotaxin-1. Combined data of three independent experiments with eosinophils from 2 different mice/experiment is shown (n = 6 mice/group). Results are expressed as fold change in expression relative to expression in WT cells in A and untreated cells in B and C that is set as 1. Data represent mean ± SEM. *P < 0.025 in C for comparison of untreated vs. eotaxin-1-treated eosinophils.
Fig. 8.
Fig. 8.
Allergen-challenged Ndst1f/fTekCre+ mice exhibit decreased lung FGF-2 expression. (A) FGF-2 expression in lung tissue of control and allergen-exposed WT and Ndst1f/fTekCre+ mice was detected by immunohistochemistry with polyclonal antibodies against FGF-2. Images representative of each group are shown. Scale bar represents 100 μm. (B) FGF-2 expression in the alveolar tissue was quantitated by image analysis using ImageJ. Five randomly selected non-overlapping fields were analyzed/mouse (n = 6 mice/group). (C) FGF-2 expression by individual inflammatory cells in the alveolar spaces of allergen-challenged WT and Ndst1f/fTekCre+ mice (n = 6 mice/group) was quantitated using ImageJ. Images of 5 non-overlapping microscopic fields were captured at a magnification of ×200 and the intensity of FGF-2 expression by 10 randomly selected cells (predominantly macrophages based on cell morphology) in each field was measured. Data represents mean ± SEM. *P < 0.01 in B for comparison of control vs. allergen-exposed WT mice. **P < 0.01 in B and C for comparison of allergen-challenged groups.

Similar articles

Cited by

References

    1. Abramoff MD, Magalhaes PJ, Ram SJ. Image Processing with ImageJ. Biophotonics International. 2004;11:36–42.
    1. Al-Muhsen S, Johnson JR, Hamid Q. Remodeling in asthma. J Allergy Clin Immunol. 2011;128:451–462. - PubMed
    1. Ali S, Fritchley SJ, Chaffey BT, Kirby JA. Contribution of the putative heparan sulfate-binding motif BBXB of RANTES to transendothelial migration. Glycobiology. 2002;12:535–543. - PubMed
    1. Allahverdian S, Harada N, Singhera GK, Knight DA, Dorscheid DR. Secretion of IL-13 by Airway Epithelial Cells Enhances Epithelial Repair via HB-EGF. Am J Respir Cell Mol Biol. 2008;38:153–160. - PMC - PubMed
    1. Axelsson J, Xu D, Kang BN, Nussbacher JK, Handel TM, Ley K, Sriramarao P, Esko JD. Inactivation of heparan sulfate 2-O-sulfotransferase accentuates neutrophil infiltration during acute inflammation in mice. Blood. 2012;120:1742–1751. - PMC - PubMed

Publication types