. 2014 Sep;26(9):1818-24.
doi: 10.1016/j.cellsig.2014.04.018. Epub 2014 May 2.

Early NADPH oxidase-2 activation is crucial in phenylephrine-induced hypertrophy of H9c2 cells

Affiliations

Early NADPH oxidase-2 activation is crucial in phenylephrine-induced hypertrophy of H9c2 cells

Nynke E Hahn et al. Cell Signal. 2014 Sep.

Abstract

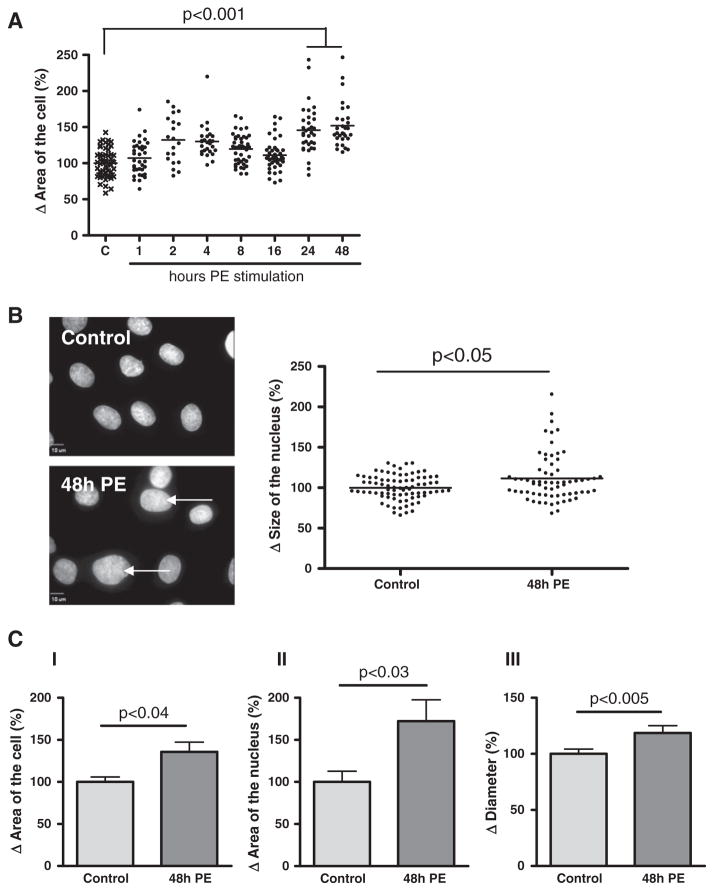
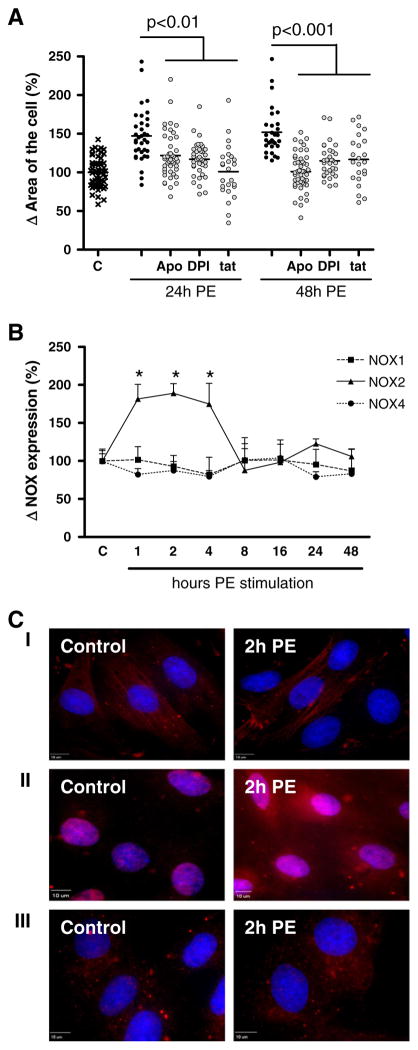
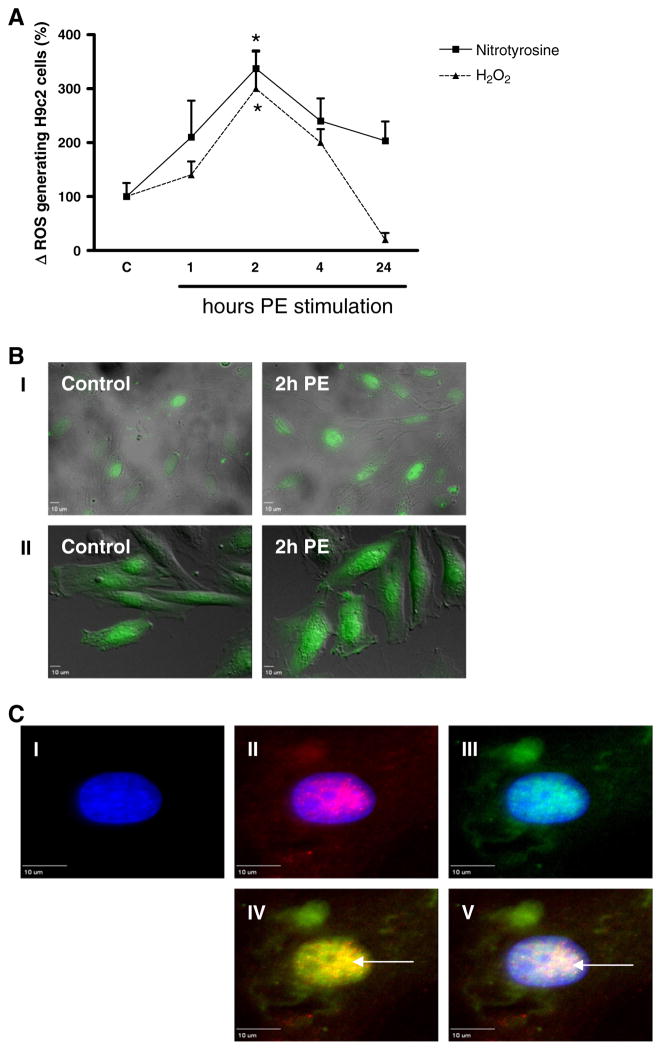
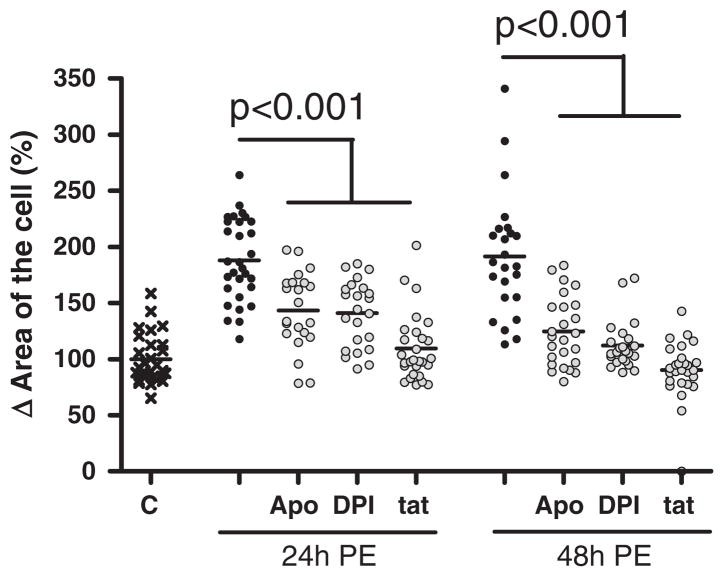
Reactive oxygen species (ROS) produced by different NADPH oxidases (NOX) play a role in cardiomyocyte hypertrophy induced by different stimuli, such as angiotensin II and pressure overload. However, the role of the specific NOX isoforms in phenylephrine (PE)-induced cardiomyocyte hypertrophy is unknown. Therefore we aimed to determine the involvement of the NOX isoforms NOX1, NOX2 and NOX4 in PE-induced cardiomyocyte hypertrophy. Hereto rat neonatal cardiomyoblasts (H9c2 cells) were incubated with 100 μM PE to induce hypertrophy after 24 and 48h as determined via cell and nuclear size measurements using digital imaging microscopy, electron microscopy and an automated cell counter. Digital-imaging microscopy further revealed that in contrast to NOX1 and NOX4, NOX2 expression increased significantly up to 4h after PE stimulation, coinciding and co-localizing with ROS production in the cytoplasm as well as the nucleus. Furthermore, inhibition of NOX-mediated ROS production with apocynin, diphenylene iodonium (DPI) or NOX2 docking sequence (Nox2ds)-tat peptide during these first 4h of PE stimulation significantly inhibited PE-induced hypertrophy of H9c2 cells, both after 24 and 48h of PE stimulation. These data show that early NOX2-mediated ROS production is crucial in PE-induced hypertrophy of H9c2 cells.

Keywords: Cardiomyocyte hypertrophy; NADPH oxidase; NOX2; Phenylephrine.


Conflict of interest statement

Disclosures

No conflict of interest exists regarding the contents of this manuscript.

Figures

Fig. 1
Fig. 1
Phenylephrine induced hypertrophy of H9c2 cells. Digital-imaging microscopy analysis of phenylephrine (PE)-stimulated H9c2 cells after different time intervals. Analysis of (A) area of the cell (n = 6) and (B) size of the nucleus (n = 4) of attached H9c2 cells. Images of nuclei are stained with DAPI (blue signal), representative for n = 4. Arrows indicate increased area of the nucleus. (C) Analysis of phenylephrine (PE)-stimulated H9c2 cells after 48 h. Electron microscopy analysis of (I) area of the cell (n = 5), (II) area of the nucleus (n = 5) and Automated Cell Counter analysis of (III) diameter (n = 3) of H9c2 cells in suspension. The changes are shown as the difference (Δ) in the percentage compared to control cells set to 100%.
Fig. 2
Fig. 2
Time-dependent role for NOX2 in phenylephrine-induced hypertrophy of H9c2 cells. Digital-imaging microscopy analysis of H9c2 cells at different time points after phenylephrine (PE)-stimulation. (A) Analysis of the effect of apocynin (Apo), diphenylene iodonium (DPI) and NOX2 docking sequence tat peptide (tat) after 24 and 48 h (n = 3). (B) NOX1, NOX2 and NOX4 expression levels (n = 4). The changes are shown as the difference (Δ) in the percentage compared to control cells set to 100%. *p < 0.001. (C) Sub-cellular localization analysis of NOX1 (I, red signal), NOX2 (II, red signal) and NOX4 (III, red signal). Nuclei are stained with DAPI (blue signal), representative for n = 4.
Fig. 3
Fig. 3
Time-dependent subcellular phenylephrine-induced ROS generation in H9c2 cells. Digital-imaging microscopy analysis of phenylephrine (PE)-stimulated H9c2 cells after different time intervals. (A) Cellular ROS levels as measured via nitrotyrosine and H2O2 (CM-H2DCFDA) (n = 3). Changes are shown as the difference (Δ) in the percentage compared to control cells set to 100%. *p < 0.01. (B) Subcellular localization analysis of nitrotyrosine (I, green signal) and H2O2 (II, green signal), representative for n = 3. (C) Subcellular localization of NOX2 and nitrotyrosine in phenylephrine-stimulated H9c2 cells. Cells were stained with DAPI (nuclei; I blue signal) and for NOX2 (II, red signal) or nitrotyrosine (III, green signal). Pictures IV and V demonstrate that after 2 h of PE (peri)nuclear NOX2 focally coincides with nitrotyrosine (yellow signal, arrow) and with DAPI (white signal, arrow).
Fig. 4
Fig. 4
Early inhibition of NOX-mediated ROS production decreases phenylephrine-induced hypertrophy. Digital-imaging microscopy analysis of phenylephrine (PE)-induced hypertrophy H9c2 cells to which apocynin (Apo), diphenylene iodonium (DPI) and NOX2 docking sequence tat peptide (tat) were added during the first 4 h only, when stimulated with PE during 24 h and 48 h (n = 3). The changes in cell area are shown as the difference (Δ) in the percentage compared to control cells set to 100%.

References

    1. Tiyyagura SR, Pinney SP. Mt Sinai J Med. 2006;73:840–851. - PubMed
    1. Swynghedauw B. Physiol Rev. 1999;79:215–262. - PubMed
    1. Devereux RB, Roman MJ. Hypertens Res. 1999;22:1–9. - PubMed
    1. Jacobi J, Schlaich MP, Delles C, Schobel HP, Schmieder RE. Am J Hypertens. 1999;12:418–422. - PubMed
    1. Tardiff JC, Hewett TE, Factor SM, Vikstrom KL, Robbins J, Leinwand LA. Am J Physiol Heart Circ Physiol. 2000;278:H412–H419. - PubMed

Publication types

MeSH terms

LinkOut - more resources