. 2014 May 12;29(3):292-304.
doi: 10.1016/j.devcel.2014.03.021. Epub 2014 May 1.

A two-tier Golgi-based control of organelle size underpins the functional plasticity of endothelial cells

Affiliations

A two-tier Golgi-based control of organelle size underpins the functional plasticity of endothelial cells

Francesco Ferraro et al. Dev Cell. .

Abstract

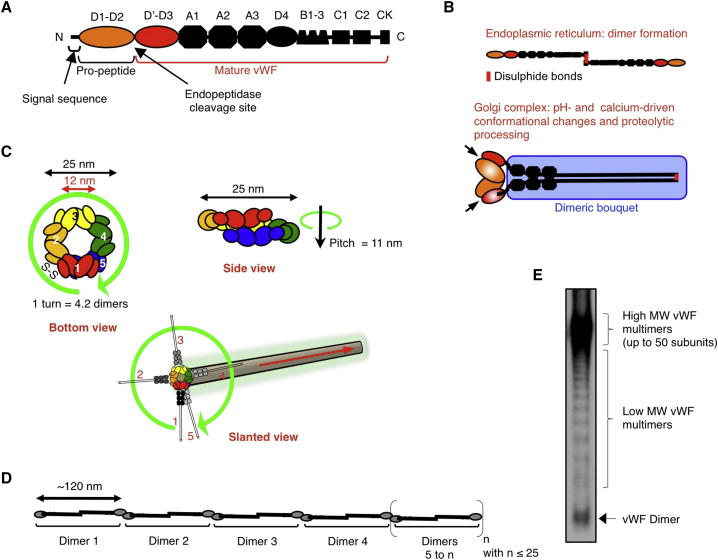
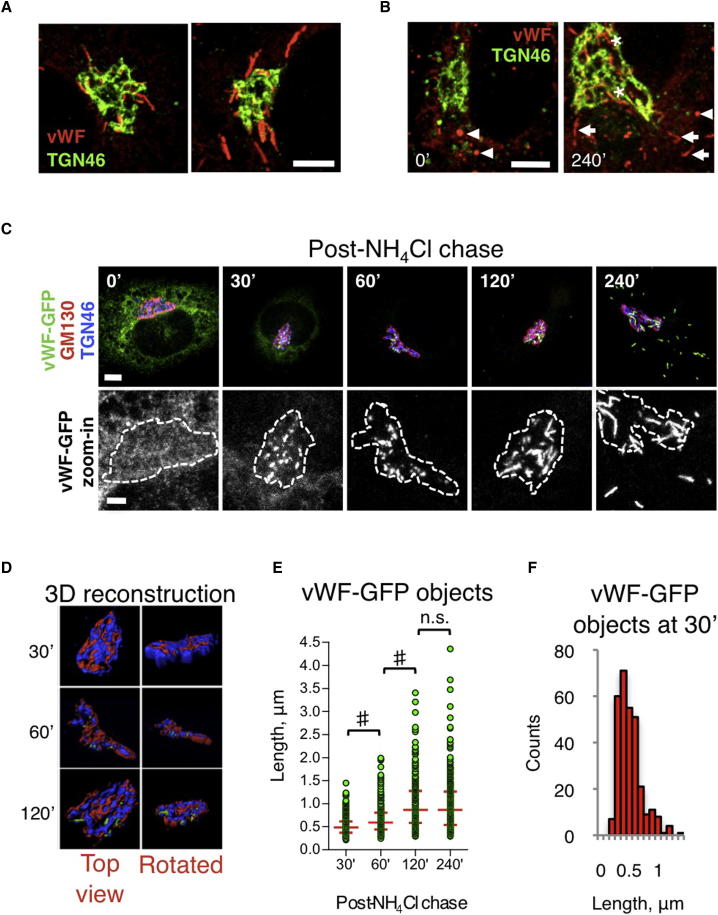
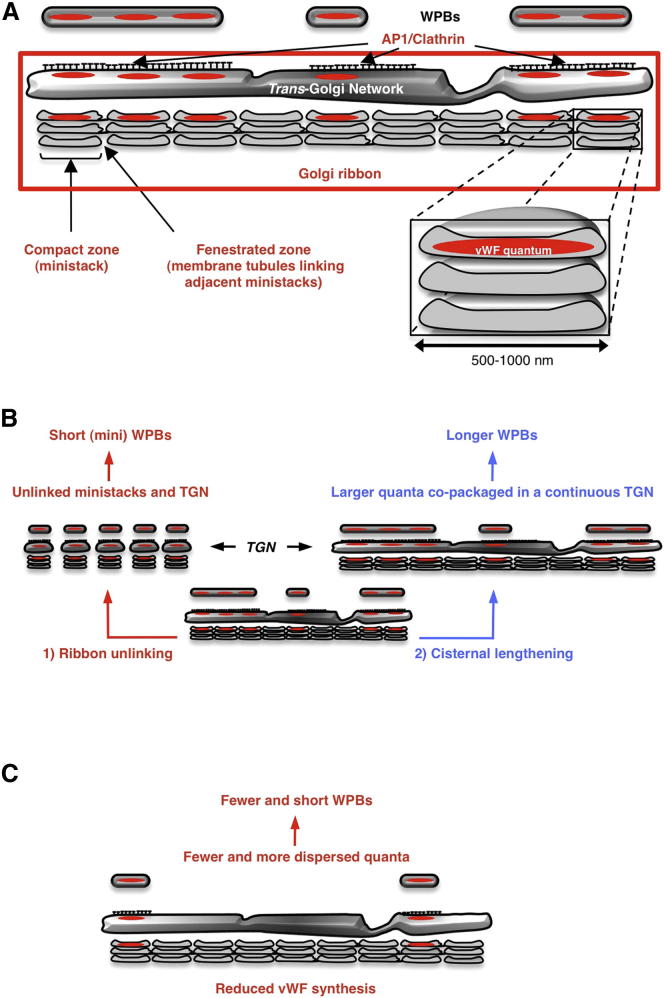
Weibel-Palade bodies (WPBs), endothelial-specific secretory granules that are central to primary hemostasis and inflammation, occur in dimensions ranging between 0.5 and 5 μm. How their size is determined and whether it has a functional relevance are at present unknown. Here, we provide evidence for a dual role of the Golgi apparatus in controlling the size of these secretory carriers. At the ministack level, cisternae constrain the size of nanostructures ("quanta") of von Willebrand factor (vWF), the main WPB cargo. The ribbon architecture of the Golgi then allows copackaging of a variable number of vWF quanta within the continuous lumen of the trans-Golgi network, thereby generating organelles of different sizes. Reducing the WPB size abates endothelial cell hemostatic function by drastically diminishing platelet recruitment, but, strikingly, the inflammatory response (the endothelial capacity to engage leukocytes) is unaltered. Size can thus confer functional plasticity to an organelle by differentially affecting its activities.


Figures

None
Graphical abstract
Figure 1
Figure 1
Biosynthesis and Structural Features of vWF (A) Diagram of the domain composition of prepro-vWF (Metcalf et al., 2008; Sadler, 1998). (B) Disulfide bonds formation in the ER generates pro-vWF dimers, and in the Golgi lumen, acidic pH and calcium promote the “dimeric bouquet” (blue boxed region) conformation (Zhou et al., 2011). Golgi’s acidic milieu is also required for proteolytic processing (arrows), likely by furin, which generates the prodomain and mature vWF. (C) At the Golgi, calcium and low pH promote vWF tubulation. A diagram of the spatial arrangement of five dimers (numbered 1–5) assembled into a tubule is shown. The propeptide (D1-D2) and the D’-D3 domains of each dimer are arranged into a right-hand helix forming the wall of the tubule (Huang et al., 2008). The helix has a period of 4.2 dimers and a pitch of 11 nm (for clarity, domains A1-CK are omitted in “bottom” and “side” views). In tubules, the configuration of D’-D3 domains of adjacent dimers is favorable to interdimer disulfide bond formation (S-S in bottom view) required for vWF multimerization. (D) Upon exocytosis, the shift to neutral pH disrupts propeptide/D’-D3 interactions and the bouquet conformation, leading to the extension of multimerized vWF. (E) vWF multimer analysis of an endothelial cell fraction containing WPBs (see Supplemental Experimental Procedures and Figure S1G). From bottom to top, bands visualize dimers, tetramers, hexamers, etc. In WPBs, the high-molecular-weight multimers contribute the majority of multimerized vWF.
Figure 2
Figure 2
A Length Unit for WPBs (A) WPBs (vWF) and the Golgi (GM130) were visualized in HUVECs; scale bar, 5 μm. Right: magnified regions exemplify WPB length variability; scale bar, 1 μm. (B) High-throughput microscopic survey; the lengths of ∼2 million WPBs were measured and modeled to a mixture of Gaussian distributions (see Supplemental Experimental Procedures). (C) Diffraction-limited (DL) images of vWF-labeled HUVECs and their STORM reconstructions. Scale bar, 2 μm; zoom, 1 μm. Arrowheads indicate vWF nanoclusters within WPBs. (D) vWF nanocluster size frequency was quantified from STORM images; n = 312; median [quartiles] = 576 [382, 797] nm. (E) Electron micrograph from an HPF/FS HUVEC sample of a WPB (membrane continuities, arrowheads) showing two distinct regions. (F and G) TEM of cell-free WPBs chemically fixed and prepared for whole-mount (F) or thick sections (G). Gray levels were color-coded to highlight variation in content density (denser regions labeled by asterisks). Scale bars in (E)–(G), 500 nm. See also Figure S1 and Table S1.
Figure 3
Figure 3
WPB Size Is Acquired before Budding from Golgi (A) WPBs in the Golgi region of untreated HUVECs. Scale bar, 5 μm. (B) WPB formation can be manipulated by NH4Cl incubation and washout. NH4Cl-treated HUVECs (2 days) were subjected to washout and fixed immediately or after 240 min, and endogenous vWF was visualized. Neutralization of the lumen induces organelle rounding (arrowheads). After Golgi reacidification (240 min), organelles forming at the Golgi were visible (asterisks) and newly made WPBs (elongated shape, arrows) repopulated the cell periphery. Scale bar, 5 μm. (C) The dynamics of WPB formation was analyzed using a vWF-GFP reporter. Dashed lines (zoom-in) outline the Golgi complex (GM130 and TGN46 staining). Scale bar, 5 μm; zoom, 2 μm. (D) 3D reconstruction of the Golgi region of the cells shown in (C); forming WPBs are within the Golgi volume up to 120 min. (E) Length of the vWF-GFP-labeled objects; medians and interquartile ranges are shown. n = 299, 243, 241, and 308 for 30’, 60’, 120’, and 240’, respectively. #p < 10−10. (F) Length frequency of vWF-GFP objects at 30 min. See also Movie S1.
Figure 4
Figure 4
Golgi Ministacks and Ribbon Architecture Determine the Size of WPBs (A–C) Effect of Golgi ribbon unlinking on newly made WPBs (vWF-GFP labeled). Unlinking was induced with nocodazole (A), by lowering the pH of the cytosol in the presence of acetate (B), or by Giantin siRNA (C). Scale bars, 10 μm; magnifications, 5 μm. (D–F) HTM analysis of WPB length in cells treated as in (A)–(C). Endogenous vWF was stained to label the whole organelle population. Cumulative frequencies (C.F.) of the organelle number were plotted as function of organelle length. Number of WPBs analyzed: ∼104–106. ###p < 10−15. (G) Cells nucleofected with vWF-GFP were incubated with NH4Cl as described in Figure 3. Golgi ribbon was unlinked with nocodazole at the indicated times after NH4Cl washout. Arrowheads indicate long WPBs; scale bar, 2 μm. (H and I) siRNA-treatment targeting Rab6a/a’ isoforms resulted in an ∼85% reduction of their protein levels (H), in agreement with the fraction of cells showing loss of Rab6 staining at the Golgi (I). Scale bars, 10 μm; magnified 5 μm. (J) Golgi-positive structures (TGN46 positive) in siRNA-treated cells incubated overnight with DMSO or nocodazole and analyzed by HTM. For each treatment, n = ∼105; ###p < 10−15. (K) siRNA-treated cells were incubated with nocodazole to unlink ministacks in order to facilitate quantification. Electron micrographs of cells were inspected and cisternal lengths were measured. Medians (quartiles): luciferase, 612 (529, 827) nm; Rab6, 829 (725, 1,029) nm. n = 47 and 77 for luciferase and Rab6 siRNAs, respectively. ∗∗∗p < 10−3. (L) vWF quantum size was measured in STORM images of siRNA-treated cells (3× GM indicates GM130, GRASP55, and Giantin triple knockdown). Medians and quartiles are shown. n = 153, 117, and 129 for luciferase, 3× GM, and Rab6 siRNAs, respectively. ∗∗p < 10−2. (M) HTM analysis of WPB length in siRNA-treated cells. For both treatments, n = ∼8 × 105; ###p < 10−15. See also Figures S2 and S3.
Figure 5
Figure 5
vWF Levels Control WPB Number and Size (A) Time course of siRNA-mediated vWF depletion (at 200 pmol siRNA/nucleofection reaction). vWF content was normalized to protein in cell lysates; mean ± SD (n = 3). (B and C) vWF depletion causes mislocalization of the WPB markers P-selectin and Rab27A (B) and a reduction in size of the residual organelles (C). Scale bars, 5 μm. (D) vWF cell content was modulated by titrating the amount of vWF-targeting siRNA delivered; mean ± SD. (E) HTM analysis of the number of WPBs per cell following vWF-targeting siRNA titration; median values are shown (n = 24 per treatment, with each observation from a separate well of 96-well plates); ∗∗∗p < 10−3 for all the pairwise comparisons. (F) Decrease in vWF cell content results in shortening of WPBs. Per treatment, n = 2.3 × 105 to 8 × 105; ###p < 10−15 for all pairwise comparisons. (G) Kernel densities for each data set in the indicated length ranges were calculated as in Figure 2B and normalized to the length cluster of highest density. The distance between the length clusters was unaffected (Table S2), indicating that vWF quantum size remains constant over an ∼20-fold change in cargo abundance (see D, Lucif. 200 pmol versus vWF 200 pmol).
Figure 6
Figure 6
WPB Size and Endothelial Function (A) vWF release in the absence or presence of histamine measured from control (200 pmol luciferase siRNA/reaction or DMSO) and mini-WPB enriched HUVEC cells (200 pmol vWF siRNA/reaction or nocodazole). Box plots of 9–18 measurements per treatment from 3–4 experiments are shown. ∗∗∗p < 10−3. (B) Cell-free WPBs were diluted and permeabilized to obtain well-separated vWF filaments. Representative images from control, VWF siRNA-, and nocodazole-treated samples are shown. Scale bar, 25 μm. (C) Cumulative frequency of vWF filament number as a function of filament length generated by cell-free WPBs obtained from HUVECs treated as indicated. DMSO, n = 858; vWF siRNA, n = 851; nocodazole, n = 885. #p < 10−10. Inset: percentage of long filaments in each treatment. (D) Formation of platelet-decorated vWF strings under flow following HUVEC stimulation with histamine. Platelets were identified by CD41/GPIIb labeling. (E) Length of platelet-decorated vWF strings; median and interquartile ranges are shown. Control, n = 366; mini-WPBs, n = 27 from 2 separate experiments. ∗∗p < 10−2. (F) Rolling of THP-1 monocyte-like cells on HUVEC monolayers following histamine stimulation; box plot of 12 measurements from 4 separate experiments. See also Figure S4.
Figure 7
Figure 7
Structural Units and Compound Architecture of the Golgi Cooperate to Generate WPB Size (A) In vertebrates, the Golgi’s structural units, the ministacks, are brought into close proximity by motors and microtubules and fuse to their neighbors via tubular connections between homologous cisternae (fenestrated zones), generating a higher-order architecture, the ribbon (boxed in red). The cisternal dimensions limit the size of the vWF quanta, but in the continuous lumen of the TGN, adjacent quanta can be copackaged together into forming organelles. This process requires the adaptor complex AP1 and clathrin, which likely act as a scaffold (Lui-Roberts et al., 2005). The size of WPBs generated in this process depends on the number of copackaged quanta. (B) Unlinking the ribbon into separated ministacks has no effect on quantum size, but partitions the TGN and prevents multiple quanta copackaging. This results in the formation of short WPBs (pathway 1). Increasing the dimension of Golgi cisternae allows formation of bigger vWF quanta, whose copackaging produces longer WPBs (pathway 2). (C) Reduced synthesis of vWF results in fewer and more dispersed quanta, which are packaged in fewer and shorter WPBs. See also Figure S5.

Comment in

  • The Golgi is a measuring cup.
    Marshall WF. Marshall WF. Dev Cell. 2014 May 12;29(3):259-60. doi: 10.1016/j.devcel.2014.04.028. Dev Cell. 2014. PMID: 24823373 Free PMC article.

Similar articles

Cited by

References

    1. Bonfanti R., Furie B.C., Furie B., Wagner D.D. PADGEM (GMP140) is a component of Weibel-Palade bodies of human endothelial cells. Blood. 1989;73:1109–1112. - PubMed
    1. Chan Y.H., Marshall W.F. Scaling properties of cell and organelle size. Organogenesis. 2010;6:88–96. - PMC - PubMed
    1. Chia J., Goh G., Racine V., Ng S., Kumar P., Bard F. RNAi screening reveals a large signaling network controlling the Golgi apparatus in human cells. Mol. Syst. Biol. 2012;8:629. - PMC - PubMed
    1. Cole N.B., Sciaky N., Marotta A., Song J., Lippincott-Schwartz J. Golgi dispersal during microtubule disruption: regeneration of Golgi stacks at peripheral endoplasmic reticulum exit sites. Mol. Biol. Cell. 1996;7:631–650. - PMC - PubMed
    1. Dacks J.B., Field M.C. Evolution of the eukaryotic membrane-trafficking system: origin, tempo and mode. J. Cell Sci. 2007;120:2977–2985. - PubMed

Publication types

MeSH terms