. 2014 Sep 15;23(18):4859-74.
doi: 10.1093/hmg/ddu200. Epub 2014 May 2.

Dysfunction of spatacsin leads to axonal pathology in SPG11-linked hereditary spastic paraplegia

Affiliations

Dysfunction of spatacsin leads to axonal pathology in SPG11-linked hereditary spastic paraplegia

Francesc Pérez-Brangulí et al. Hum Mol Genet. .

Abstract

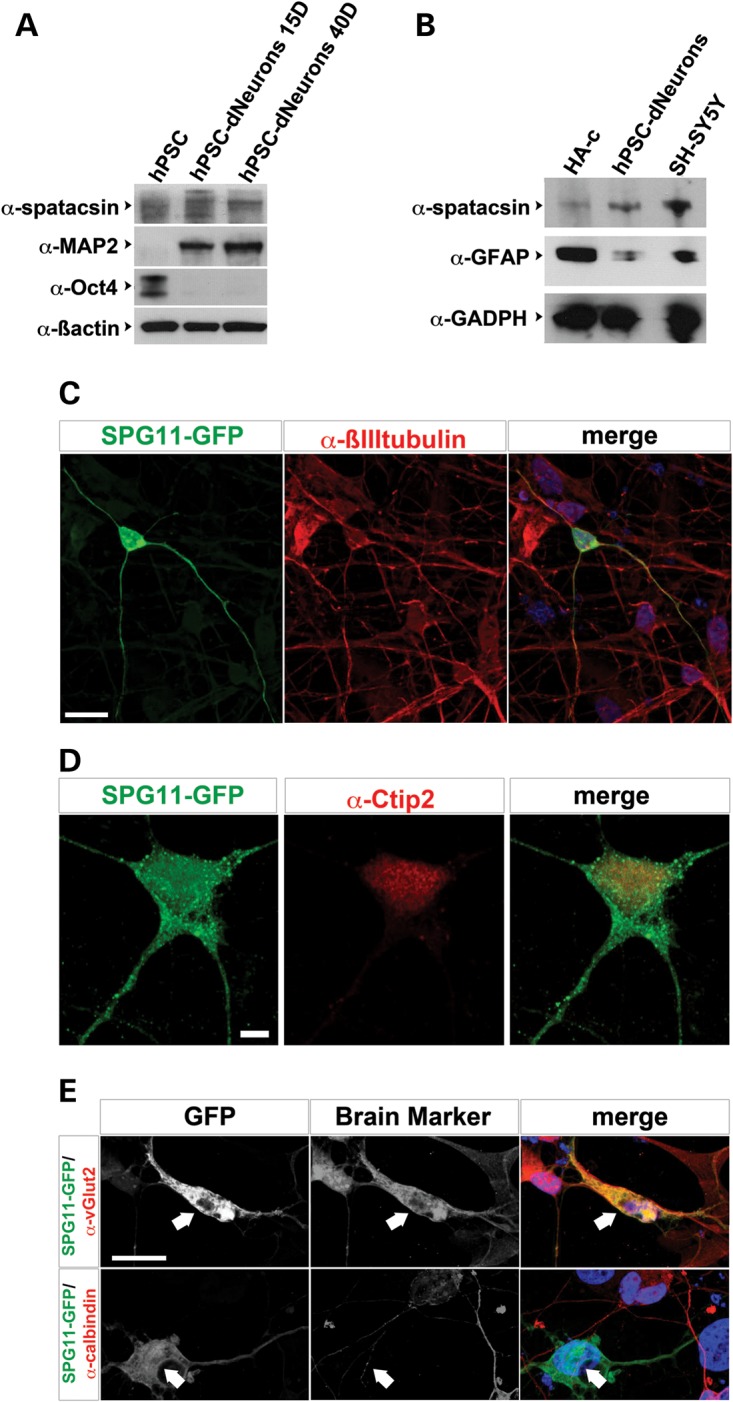
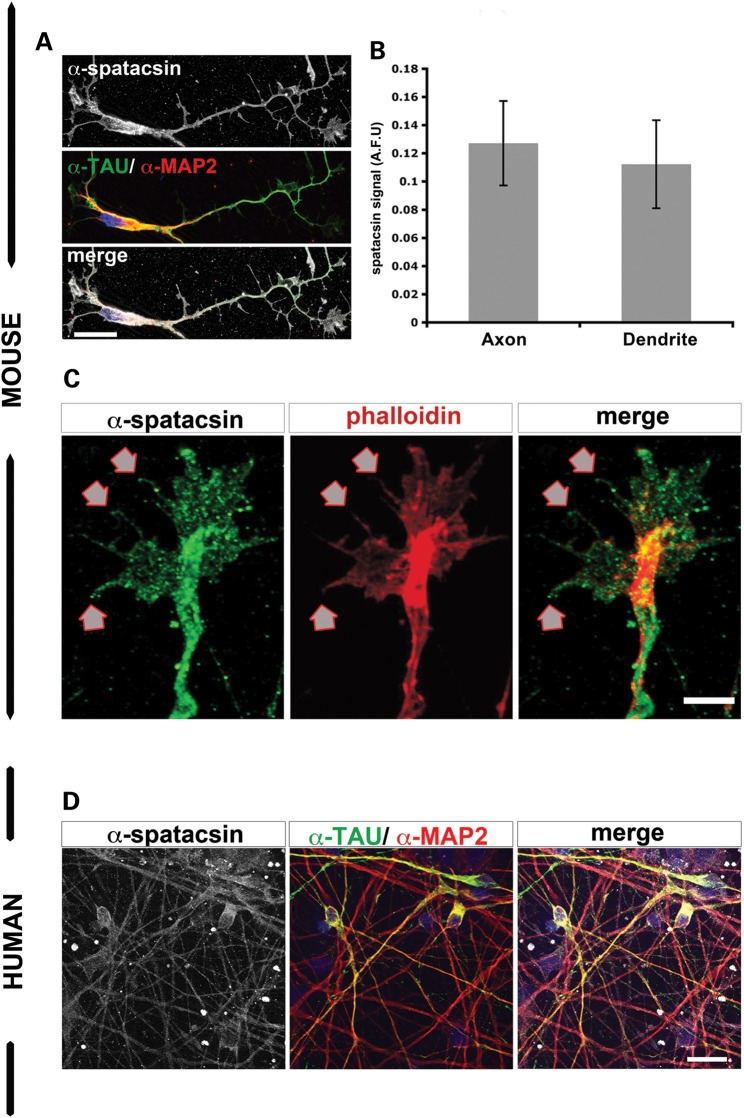
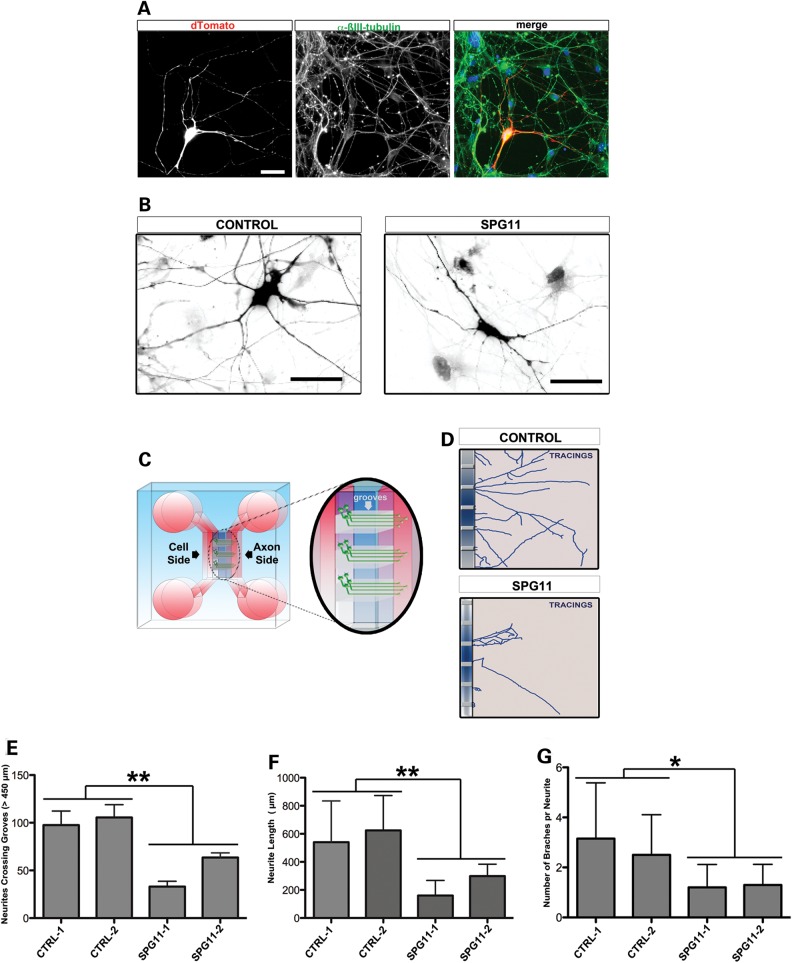
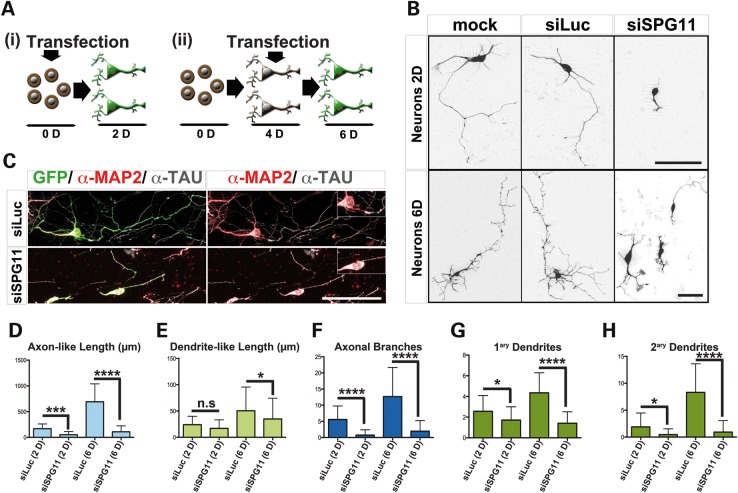
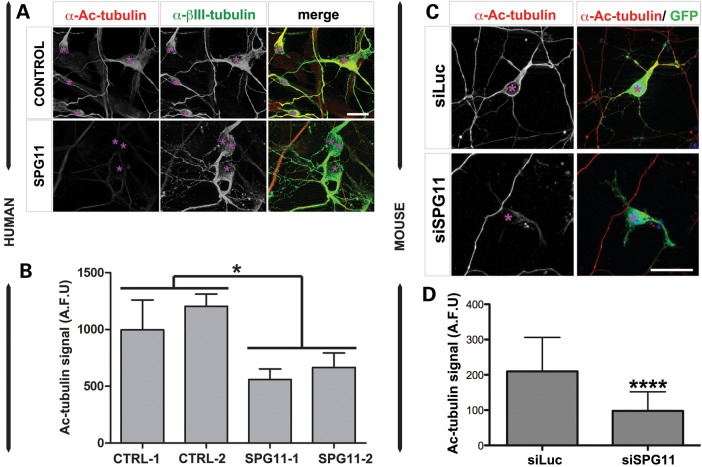
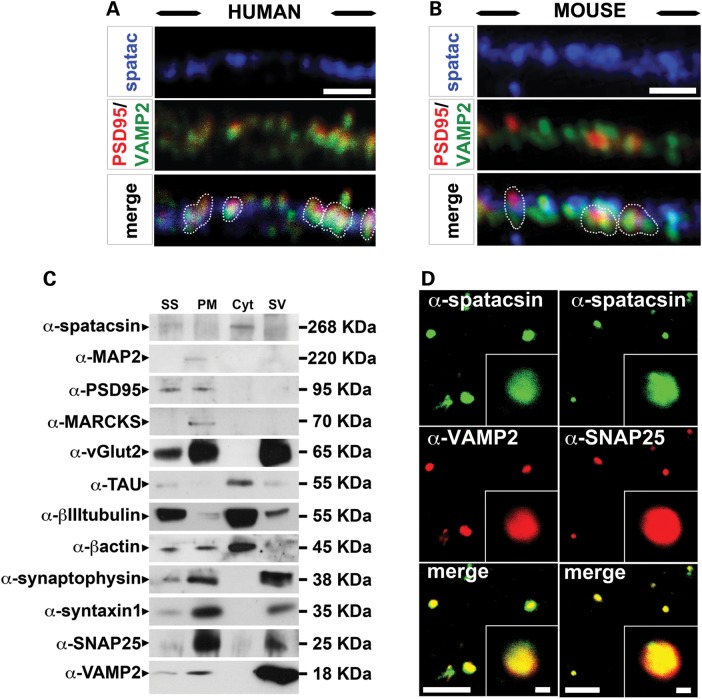
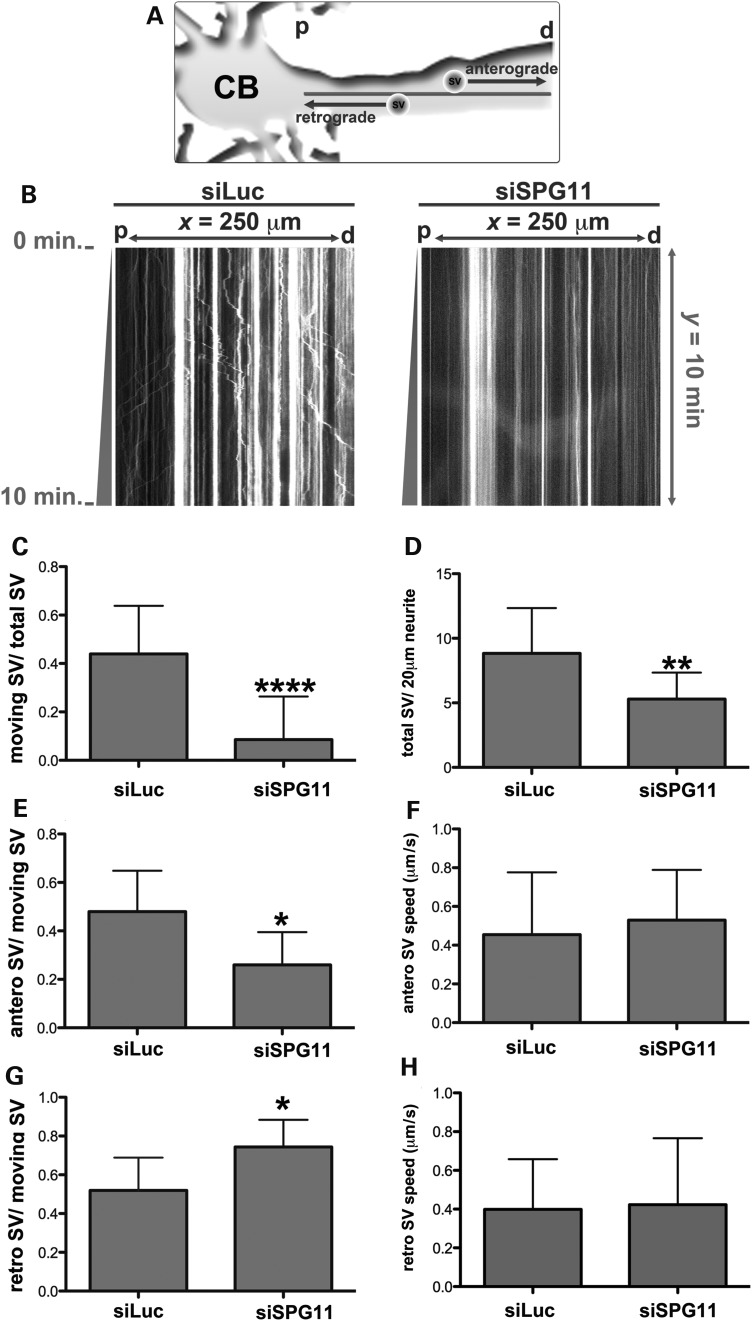
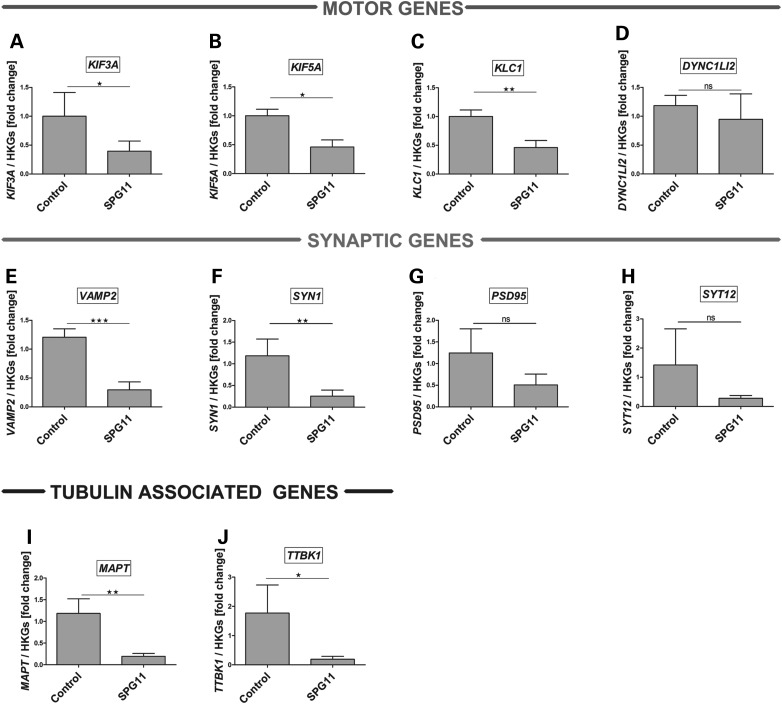
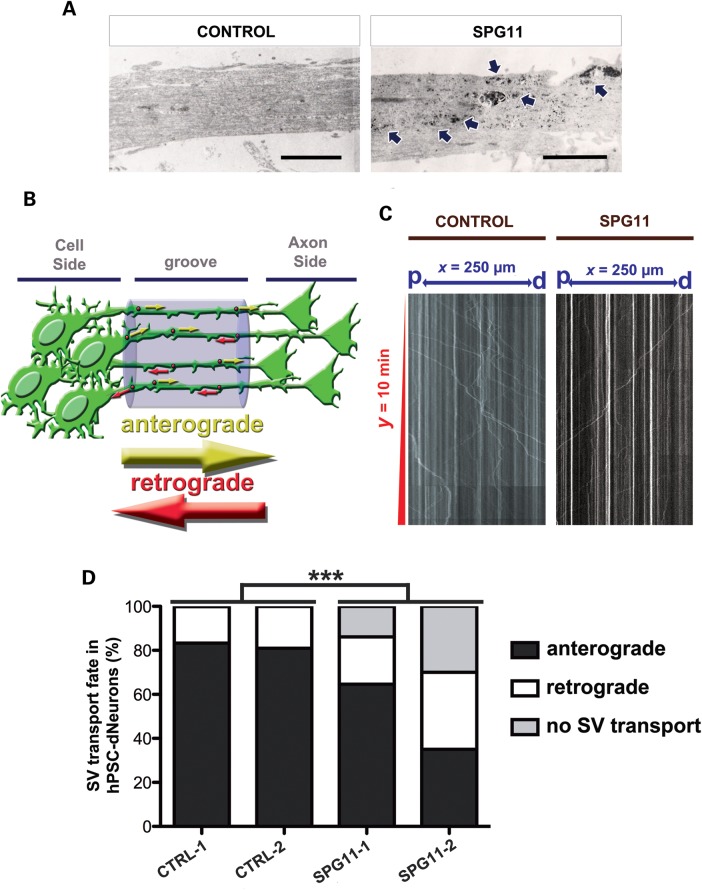
Hereditary spastic paraplegias are a group of inherited motor neuron diseases characterized by progressive paraparesis and spasticity. Mutations in the spastic paraplegia gene SPG11, encoding spatacsin, cause an autosomal-recessive disease trait; however, the precise knowledge about the role of spatacsin in neurons is very limited. We for the first time analyzed the expression and function of spatacsin in human forebrain neurons derived from human pluripotent stem cells including lines from two SPG11 patients and two controls. SPG11 patients'-derived neurons exhibited downregulation of specific axonal-related genes, decreased neurite complexity and accumulation of membranous bodies within axonal processes. Altogether, these data point towards axonal pathologies in human neurons with SPG11 mutations. To further corroborate spatacsin function, we investigated human pluripotent stem cell-derived neurons and mouse cortical neurons. In these cells, spatacsin was located in axons and dendrites. It colocalized with cytoskeletal and synaptic vesicle (SV) markers and was present in synaptosomes. Knockdown of spatacsin in mouse cortical neurons evidenced that the loss of function of spatacsin leads to axonal instability by downregulation of acetylated tubulin. Finally, time-lapse assays performed in SPG11 patients'-derived neurons and spatacsin-silenced mouse neurons highlighted a reduction in the anterograde vesicle trafficking indicative of impaired axonal transport. By employing SPG11 patient-derived forebrain neurons and mouse cortical neurons, this study provides the first evidence that SPG11 is implicated in axonal maintenance and cargo trafficking. Understanding the cellular functions of spatacsin will allow deciphering mechanisms of motor cortex dysfunction in autosomal-recessive hereditary spastic paraplegia.


Figures

Figure 1.
Figure 1.
Characterization of spatacsin expression in human-derived neurons. (A) Blots of HUES6 (hPSC), HUES6-dNeurons cultured in neuronal differentiation media for 15 (hPSC-dNeurons 15D) or 40 days (hPSC-dNeurons 40D). Blots were probed with α-spatacsin. Oct4 and MAP2 were employed as stem cell and neuronal markers, respectively. β-Actin served as loading control. (B) Blots of homogenates from human astrocytes (HA-c), HUES6-dNeurons (hPSC-dNeurons) and SH-SY5Y cells were probed with α-spatacsin, α-GFAP and α-GADPH as loading control. (C) HUES6-dNeurons cultures transfected with SPG11::GFP (SPG11-GFP, green) were labeled with α-βIII-tubulin (red) and DAPI (blue). Scale bar = 20 µm. (D) HUES6-dNeurons cultures transfected with SPG11::GFP (green) were stained with α-Citp2 (red). Scale bar = 5 µm. (E) HUES6-dNeurons transfected with SPG11::GFP (SPG11-GFP; green) colabeled with antibodies against α-vGlut2 or α-calbindin (red; arrows). Scale bar = 20 µm.
Figure 2.
Figure 2.
Spatacsin was present in the most distal tips of neurites of human pluripotent stem cell-derived neurons and mouse cortical neurons. (A) Mouse cortical neurons showed spatacsin expression (gray) together with the axonal marker α-TAU (green) and the dendritic marker α-MAP2 (red). Scale bar = 20 µm. (B) Graph for spatacsin expression as arbitrary fluorescent units (AFU) in axons (TAU+ neurites) and dendrites (MAP2+ neurites) of mouse cortical neurons; data represented as mean ± SD (P > 0.05); n ≥ 50 neurons per experimental condition were evaluated. (C) Spatacsin was observed in filopodia and membrane protusions (arrows) of growth cones of mouse cortical neurons. Scale bar = 5 µm. (D) Immunofluorescence analysis of HUES6-dNeuron cultures showed α-spatacsin (gray) overlapped with α-MAP2 (red) and α-TAU (green) markers. Scale bar = 50 µm.
Figure 3.
Figure 3.
Significant reduction in axonal complexity of hiPSC-dNeurons from SPG11 patients. (A) Representative figure of hiPSC-dNeuron cultures transfected with pEF1-dTomato. The cells analyzed were coexpressing dTomato and the neuronal marker βIII-tubulin. Scale bar = 20 µm. (B) Neuronal cells from control and SPG11 patient, transfected with pEF1-dTomato, showing a marked decrease in neurite complexity. Scale bars = 50 µm. (C) Schematic representation of the microfluidic chamber showing the cell soma side and axonal side; inset shows the grooves in the chamber along which axons unidirectionally pass through. (D) Tracing of control and SPG11 neurites reaching the axonal side. Neurites in SPG11-dNeurons are shorter and have less branches compared with controls. (E–G) Graphs representing (E) the reduced number of neurites crossing the grooves, (F) the reduced total neurite length (µm) and (G) the reduced number of branching points in SPG11 compared with controls. Data are represented as mean ± SD (*P < 0.05 and **P ≤ 0.005); n ≥ 20 axonal processes per each cell line; two lines from CTRL-1 and CTRL-2 and two lines from SPG11-1 and SPG11-2 were employed.
Figure 4.
Figure 4.
Knockdown of spatacsin impaired neurite outgrowth. (A) Scheme showing the two experimental strategies employed on mouse cortical neurons: (i) Dissociated mouse cortical neurons were transfected with siRNA together with GFP prior to seeding (Day 0) and then cultured for 2 days (Day 2). (ii) Neurons were transfected after 4 days in culture (Day 4). After transfection, cells were maintained for two additional days in culture (Day 6). (B) Photographs of mouse cortical neurons transfected with GFP (MOCK) only or together with either siLuc or siSPG11. The panel included examples of transfected neurons kept in culture for Day 2 (Neurons 2D, experiment i) and Day 6 (Neurons 6D, experiment ii). Scale bars = 50 µm. (C) Cortical neurons transfected with GFP (green) together with either siLuc or siSPG11 were colabeled with α-MAP2 (red) and α-TAU (gray). Scale bar = 50 µm. Note the abnormal MAP2-TAU overlap (insets) observed in siSPG11+ neurons in contrast to siLuc+ neurons. (D–H) Diagrams showing axonal length (D), dendrite length (E), number of branches per axon (F), number of dendrites per neuron (G) and the total number of secondary dendrites (H) in neurons transfected with siLuc or siSPG11 and cultured for Day 2 or 6. Measurements are presented as mean ± SD (*P < 0.05, ***P < 0.001 and ****P < 0.0001); n = 50–100 neurons per experimental condition.
Figure 5.
Figure 5.
Reduction of acetyl-tubulin in hiPSC-dNeurons from SPG11 patients and spatacsin-silenced mouse neurons. (A) Cultures of hiPSC-dNeurons of SPG11 patients (SPG11) and healthy subjects (CONTROL) were colabeled with acetyl-tubulin (α-Ac-tubulin, red) and βIII-tubulin (α-βIII-tubulin, green). Scale bar = 10 µm. (B) Graph for acetylated tubulin signal (Ac-tubulin) in cultures of hiPSC-dNeurons of two controls (CTRL-1 and CTRL-2) and two SPG11 patients (SPG11-1 and SPG11-2). Levels of acetylated tubulin signal were significantly decreased in hiPSC-dNeurons of SPG11 patients compared with controls. Data were expressed as arbitrary fluorescent units (AFU), and represented as mean ± SD (*P < 0.05); n ≥ 100 neurons per experimental condition were evaluated. (C) Mouse cortical neurons transfected with pCMV-GFP (GFP, green) and either siLuc or siSPG11. Neurons were stained with α-acetyl-tubulin (red, α-Ac-tubulin). Scale bar = 20 µm. (D) Graph for acetylated tubulin signal (Ac-tubulin) in siLuc and siSPG11-transfected mouse cortical neurons. Levels of Ac-tubulin signal were significantly decreased following knockdown of spatacsin. Data were expressed as arbitrary fluorescent units (AFU) and represented as mean ± SD (***P < 0.001); n ≥ 50 neurons per experimental condition were evaluated.
Figure 6.
Figure 6.
Characterization of spatacsin expression in synapses. (A and B) Spatacsin (blue) partially overlapped (indicated in white dotted lines) with the presynaptic marker VAMP2 (green) and the postsynaptic marker PSD95 (red) in HUES6-dNeurons (A) and in mouse cortical cultures (B). Scale bars = 1 µm. (C) Blots of samples from mouse synaptosome (SS) and the following synaptosomal factions: synaptosomal plasmatic membrane (PM), synaptosomal cytosol (Cyt) and synaptic vesicles (SV). Blots were probed with α-spatacsin, the postsynaptic markers α-PSD95 and α-MARCKS, the presynaptic markers α-SNAP25 and α-syntaxin1, the vesicle markers α-vGlut2, α-synaptophysin, and α-VAMP2; and the cytoskeleton markers α-MAP2, α-TAU, α-β-actin and a-βIII-tubulin. Spatacsin was predominantly in the Cyt fraction. (D) Purified mouse synaptosomes probed with α-spatacsin (green) together with either α-VAMP2 or α-SNAP25 (red). Scale bars = 40 and 1 µm in overviews and insets, respectively.
Figure 7.
Figure 7.
Knockdown of spatacsin disrupts SV transport. (A) Illustration of time-lapse monitoring of SV transport. SVs were visualized in neurons by expressing synaptophysin-mCherry. The neuronal cell body (CB) was used as a reference to regionalize proximal (p) and distal (d) neurite regions, and thereby distinguish the directions of anterograde and retrograde transports. (B) Kymographs representing SV transport in neurites transfected with synaptophysin-mCherry together with siLuc or siSPG11. The x-axis represents the neurite length (x = 250 µm) from proximal (p) to distal (d) areas. The y-axis indicates time-lapse duration in min (y = 10 min). Vertical lines exemplified stationary SVs (x < 5 µm), trajectories with × ≥ 5 µm considered moving SVs. Movements toward ‘p’ or ‘d’ revealed retrograde or anterograde transport, respectively. (C–H) Graphs indicate a significant decrease in the number of moving SVs and the average SV speed. All data were represented as mean ± SD; n ≥ 20 axons per experimental condition. (C) The ratio of total moving SVs in relation to the total number of SVs (****P < 0.0001). (D) The ratio of total SVs (total SV) per each 20 µm of neurite (**P ≤ 0.005). (E) The ratio between SVs moving anterogradely (antero SV) in relation to the total number of moving SVs (*P < 0.05). (F) The average speed of SVs moving anterogradely (antero SV speed in µm/s) (P > 0.05). (G) The ratio between SVs moving retrogradely (retro SV) in relation to the total number of moving SVs (*P < 0.05). (H) The average speed of SVs moving retrogradely (retro SV speed in µm/s; P > 0.05).
Figure 8.
Figure 8.
Expression analysis of transport-related genes in hiPSCs-derived neurons. RT-PCR analysis of genes in SPG11 patient-derived neurons revealed a significant reduction in the mRNA expression of kinesin-related genes, KIF3A (A), KIF5A (B) and KLC1 (C), but no difference in the expression level of DYNC1LI2 (D) compared with control. Similarly, expression of synaptic genes, VAMP2 (E), SYN1 (F), but not postsynaptic density protein 95 (PSD95) (G) and synaptotagmin 12 (SYT12) (H) are strongly reduced in patient neurons. A strong downregulation of the cytoskeletal tubulin-associated genes, MAPTAU (I) and TAU tubulin kinase 1 (TTBK1) (J) further suggested dysregulation of transport activity in the patient neurons. Plotted are means of each line performed in triplicates, from two independent experiments. Data shown as mean ± SD. mRNA levels were normalized against two housekeeping genes (HKGs = GAPDH and β2M).
Figure 9.
Figure 9.
Human neurons derived from SPG11 iPSCs accumulate membrane-like deposits within neurites and compromise anterograde transport of SVs. (A) Ultrastructural analysis of the axonal processes of hiPSC-dNeurons from control (CTRL-1) and SPG11 patient (SPG11-1). Arrows indicate the presence of membranous inclusions in SPG11 neurons. Scale bars = 2 µm. (B) Illustration of time-lapse monitoring for SV transport in synaptophysin-mCherry+ hiPSC-dNeurons grown in microfluidic chambers. SVs mowing towards either the axon or the cell side were considered as anterograde and retrograde transports, respectively. (C) Kymographs representing SV transport in synaptophysin-mCherry+ axonal processes of neurons derived from controls (CONTROL) and SPG11 (SPG11) hiPSCs . The x-axis represents the distance (x = 250 µm) between cell side (p) and axon (d) sides. The y-axis indicates time-lapse duration in min (y = 10 min). Vertical lines exemplified stationary SVs (x < 5 µm), trajectories with x ≥ 5 µm were considered moving SVs. Movements toward ‘p’ or ‘d’ revealed retrograde or anterograde transport, respectively. (D) Graphs indicated a significant difference in the transport fate of SPG11 neurons (SPG11-1 and SPG11-2) in comparison to controls (CTRL-1 and CTRL-2). All data were represented as mean ± SD; ***P < 0.005; n ≥ 20 axons per experimental condition.

References

    1. Harding A.E. Classification of the hereditary ataxias and paraplegias. Lancet. 1983;1:1151–1155. - PubMed
    1. Bettencourt C., Lopez-Sendon J., Garcia-Caldentey J., Rizzu P., Bakker I., Shomroni O., Quintans B., Davila J., Bevova M., Sobrido M.J., et al. Exome sequencing is a useful diagnostic tool for complicated forms of hereditary spastic paraplegia. Clin. Genet. 2013;85:154–158. - PubMed
    1. Stevanin G., Santorelli F.M., Azzedine H., Coutinho P., Chomilier J., Denora P.S., Martin E., Ouvrard-Hernandez A.M., Tessa A., Bouslam N., et al. Mutations in SPG11, encoding spatacsin, are a major cause of spastic paraplegia with thin corpus callosum. Nat. Genet. 2007;39:366–372. - PubMed
    1. Hehr U., Bauer P., Winner B., Schule R., Olmez A., Koehler W., Uyanik G., Engel A., Lenz D., Seibel A., et al. Long-term course and mutational spectrum of spatacsin-linked spastic paraplegia. Ann. Neurol. 2007;62:656–665. - PubMed
    1. Winner B., Uyanik G., Gross C., Lange M., Schulte-Mattler W., Schuierer G., Marienhagen J., Hehr U., Winkler J. Clinical progression and genetic analysis in hereditary spastic paraplegia with thin corpus callosum in spastic gait gene 11 (SPG11) Arch. Neurol. 2004;61:117–121. - PubMed