. 2014 Jun 13;289(24):17174-83.
doi: 10.1074/jbc.M113.546135. Epub 2014 May 2.

α1-adrenergic receptor signaling in osteoblasts regulates clock genes and bone morphogenetic protein 4 expression through up-regulation of the transcriptional factor nuclear factor IL-3 (Nfil3)/E4 promoter-binding protein 4 (E4BP4)

Affiliations

α1-adrenergic receptor signaling in osteoblasts regulates clock genes and bone morphogenetic protein 4 expression through up-regulation of the transcriptional factor nuclear factor IL-3 (Nfil3)/E4 promoter-binding protein 4 (E4BP4)

Takao Hirai et al. J Biol Chem. .

Abstract

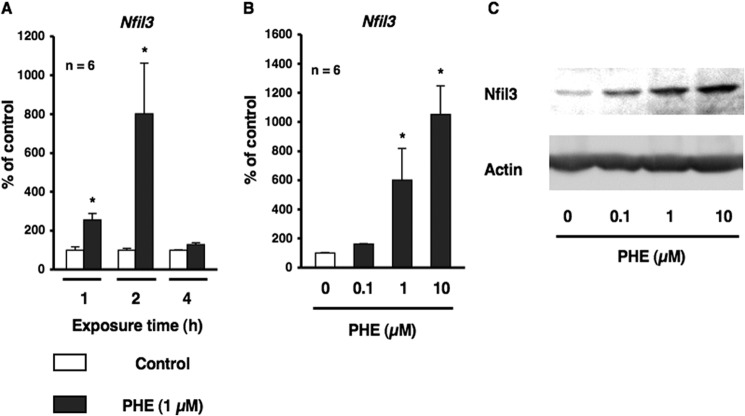
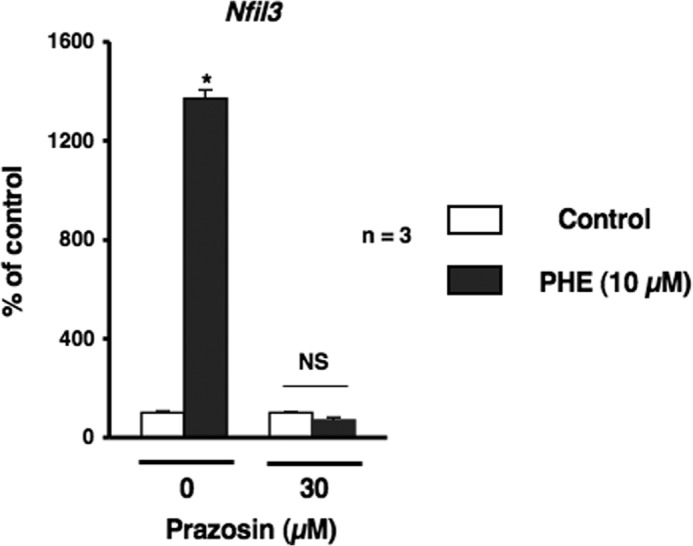
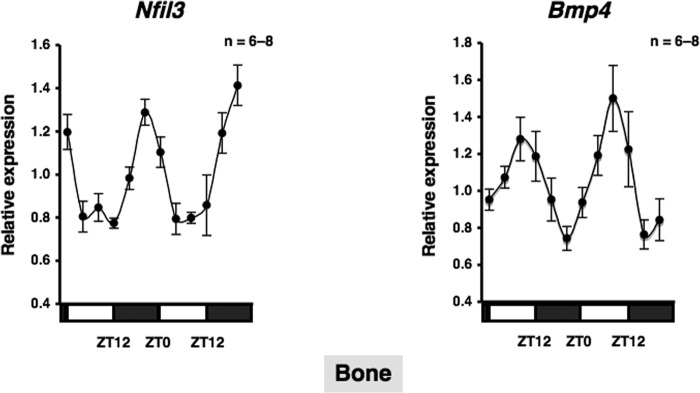
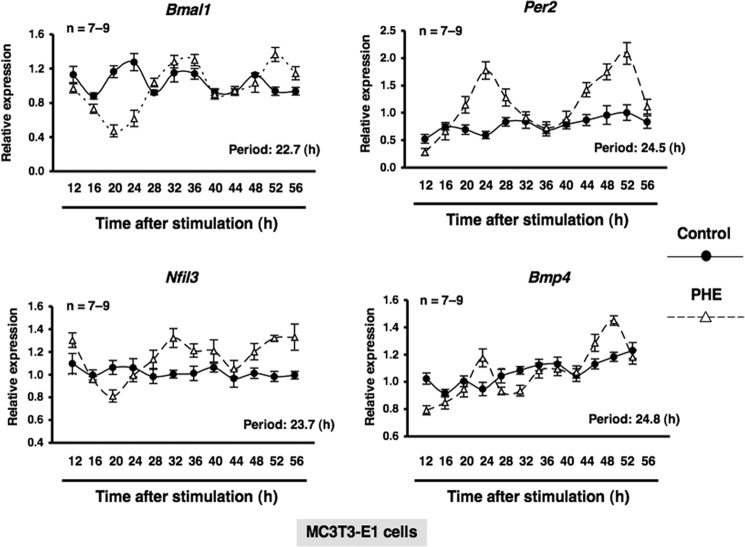
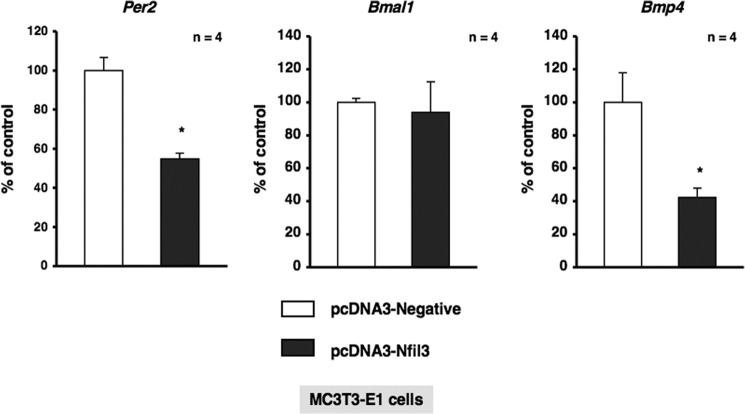
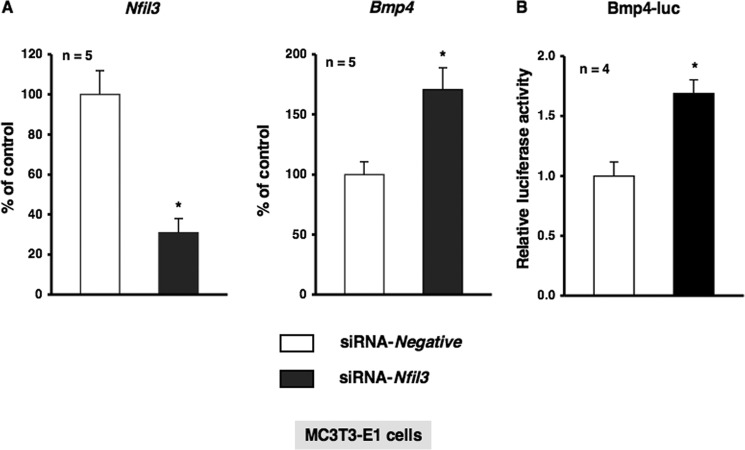
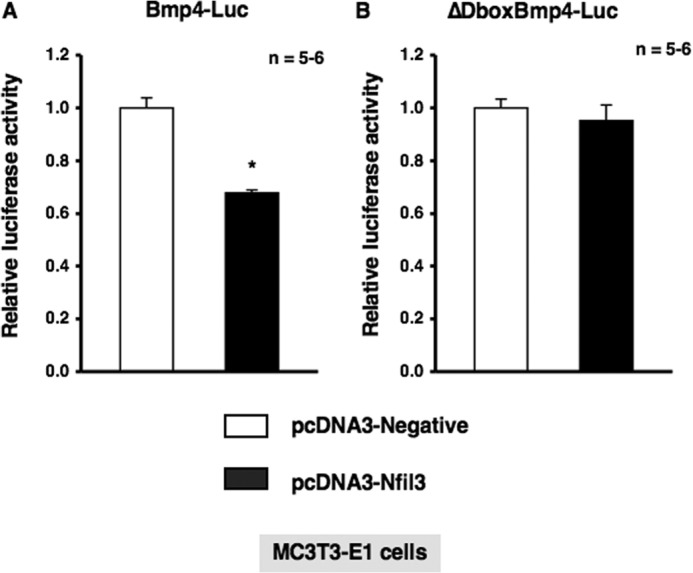
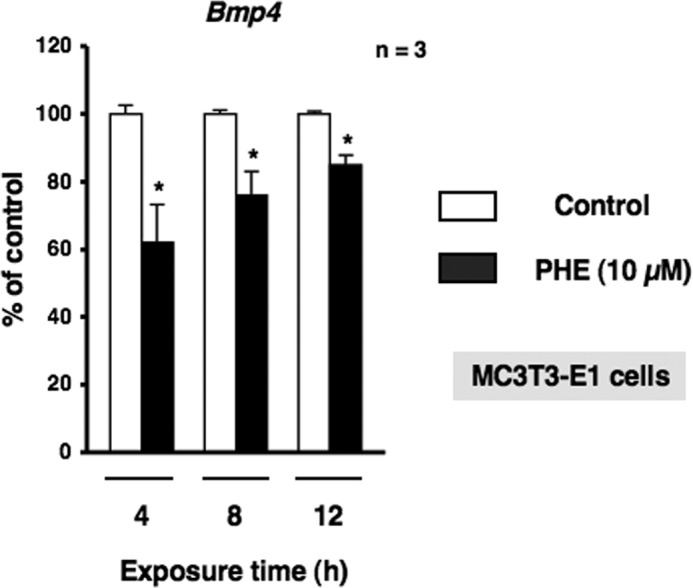
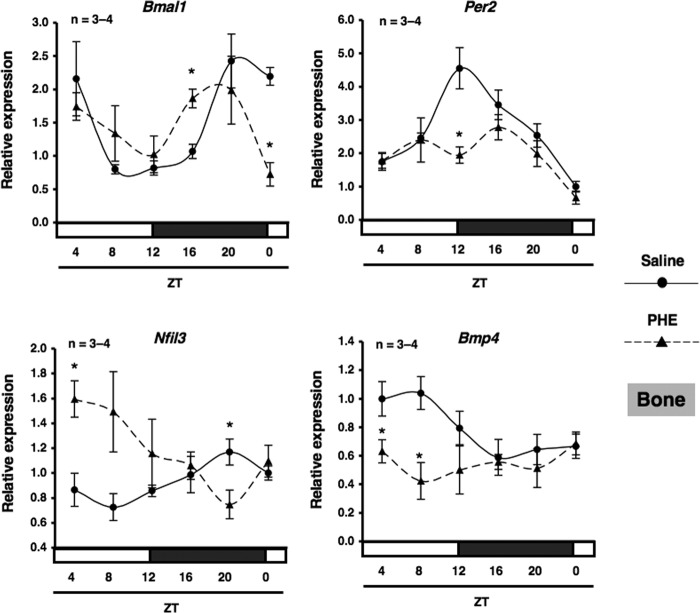
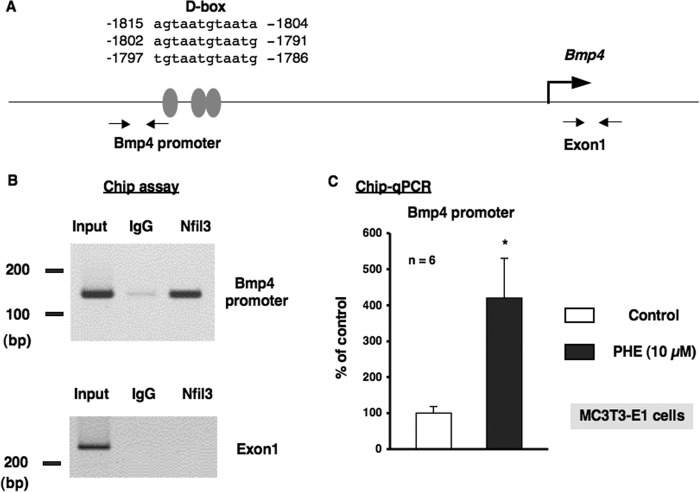
Several studies have demonstrated that the α1-adrenergic receptor (AR) plays an important role in regulating cell growth and function in osteoblasts. However, the physiological role of α1-AR signaling in bone metabolism is largely unknown. In this study, the stimulation of phenylephrine (PHE), a nonspecific α1-AR agonist, increased the transcriptional factor Nfil3/E4BP4 and led to the rhythmic expression of bone morphogenetic protein 4 (Bmp4) in MC3T3-E1 osteoblastic cells. We also showed that Bmp4 mRNA expression peaked in bone near zeitgeber time 8 in a 24-h rhythm. Furthermore, the expression of Nfil3 and Bmp4 displayed a circadian pattern with opposing phases, which suggested that Nfil3 repressed the expression of the Bmp4 gene during a circadian cycle. On a molecular level, both loss-of-function and gain-of-function experiments demonstrated that Nfil3/E4BP4 negatively regulated Bmp4 expression in osteoblasts. Furthermore, the systemic administration of PHE increased the expression of Nfil3 mRNA in bone, whereas it decreased that of Bmp4 mRNA. The expression of Bmp4 mRNA was decreased significantly by exposure to PHE, and this was concomitant with the increase in Nfil3 binding to the D-box-containing Bmp4 promoter region in MC3T3-E1 cells, which indicates that the expression of Nfil3 by α1-AR signaling can bind directly to the Bmp4 promoter and inhibit Bmp4 expression in osteoblasts. Our results suggest that α1-AR signaling regulates clock genes and Bmp4 expression in osteoblasts. Moreover, α1-AR signaling negatively regulated Bmp4 expression by up-regulating the transcriptional factor Nfil3/E4BP4 in osteoblasts.

Keywords: Adrenergic Receptor; Bmp4; Bone Morphogenetic Protein (BMP); Clock Gene; Nfil3; Osteoblast; Transcription Factor; α1-Adrenergic Receptor.


Figures

FIGURE 1.
FIGURE 1.
α1-AR signaling up-regulated the transcriptional factor Nfil3 in MC3T3-E1 cells. A, Nfil3 mRNA expression in MC3T3-E1 cells. Cells were treated with 1 μm PHE for 1, 2, and 4 h, harvested, and then processed for real-time qRT-PCR. Each value represents the mean ± S.E. of six separate experiments. *, p < 0.05, significantly different from each control value obtained in MC3T3-E1 cells cultured in the absence of PHE. B, Nfil3 mRNA was up-regulated by PHE in a concentration-dependent manner in MC3T3-E1 cells. Cells were treated with PHE at 0.1–10 μm for 2 h, harvested, and processed for real-time qRT-PCR. Each value represents the mean ± S.E. of six separate experiments. *, p < 0.05, significantly different from each control value obtained in MC3T3-E1 cells cultured in the absence of PHE. C, the transcriptional factor Nfil3 was increased by PHE in a dose-dependent manner in MC3T3-E1 cells. Cells were treated with PHE at 0.1–10 μm for 4 h, harvested, and then processed for Western blotting. A representative result of three individual experiments is shown.
FIGURE 2.
FIGURE 2.
α1-AR signaling mediated Nfil3 mRNA expression after the PHE stimulation in MC3T3-E1 cells. Cells were incubated for 2 h in the presence of PHE with prazosin at a concentration of 10 μm, followed by the determination of Nfil3 levels by real-time qRT-PCR. Each value represents the mean ± S.E. of three separate experiments. *, p < 0.05, significantly different from each control value. NS, not significant.
FIGURE 3.
FIGURE 3.
Nfil3 and Bmp4 in bone. A representation of the expression of Nfil3 and Bmp4 in bone from C57BL/6J mice under light/dark cycle conditions. Bone was obtained from C57BL/6J mice every 4 h. Total RNA was isolated, and the level of mRNA was determined by real-time qRT-PCR using specific primers for Nfil3 and Bmp4. Relative mRNA levels were normalized to the Gapdh level. Data represent the mean ± S.E., n = 6–8 animals. White boxes, light period; black boxes, dark period.
FIGURE 4.
FIGURE 4.
α1-AR signaling mediated circadian rhythmicity in MC3T3-E1 cells. Expression profiles of the Bmal1 (upper left), Per2 (upper right), Nfil3 (lower left), and Bmp4 (lower right) transcript generated by PHE in MC3T3-E1 osteoblastic cells. Total RNA samples were collected at the indicated times after PHE treatment. qRT-PCR analyses of transcript levels were performed using their specific primers. Gapdh was used as an internal control. Each value represents the mean ± S.E. (n = 7–9 independent experiments). *, p < 0.05, significantly different from each control value. The Cosinor analysis method was used to determine the rhythmic expression. The lines show the fitting curves.
FIGURE 5.
FIGURE 5.
Nfil3 negatively regulated Per2 and Bmp4 in MC3T3-E1 cells. Effects of the overexpression of Nfil3 in MC3T3-E1 cells. MC3T3-E1 cells were stably transfected with expression vectors for Nfil3 (pcDNA-Nfil3) or control (pcDNA-Negative), followed by further cultivation for 48 h and the subsequent determination of Per2, Bmal1, and Bmp4 levels by real-time qRT-PCR. Each value represents the mean ± S.E. of four separate experiments. *, p < 0.05, significantly different from the value obtained in cells transfected with the control vector.
FIGURE 6.
FIGURE 6.
Nfil3 knockdown by siRNA on the Bmp4 transcript in MC3T3-E1 cells. A, MC3T3-E1 cells were treated with Nfil3 siRNA (siRNA-Nfil3) or non-silencing RNA (siRNA-Negative) according to the indicated protocols. Real-time qRT-PCR analyses of transcript levels were performed using their specific primers for Nfil3 and Bmp4. Relative mRNA expression was normalized to Gapdh. Each value represents the mean ± S.E. of five independent determinations. *, p < 0.05, significantly different from each control value. B, MC3T3-E1 cells were transiently transfected with Bmp4-Luc in the presence of siRNA-Nfil3 or siRNA-Negative according to the indicated protocols. The luciferase activity was determined 48 h after transfection. Firefly luciferase activities were normalized by Renilla luciferase activities. Each value is the mean ± S.E. of four independent experiments. *, p < 0.05, significantly different from each control value.
FIGURE 7.
FIGURE 7.
Deletion of putative D-box elements abolished Nfil3-mediated suppression of Bmp4 luciferase activity. A, MC3T3-E1 cells were transiently transfected with Bmp4-Luc in either the presence or absence of the Nfil3 expression plasmid. Luciferase activity was determined 48 h after transfection. The total amount of DNA transfected was standardized with an empty vector. Firefly luciferase activities were normalized by Renilla luciferase activities. Each value is the mean ± S.E. (n = 5–6 independent experiments). *, p < 0.05, significantly different from each control value. B, MC3T3-E1 cells were transfected with ΔDboxBmp4-Luc in either the presence or absence of the Nfil3 expression plasmid. The luciferase activity was determined 48 h after transfection. The total amount of DNA transfected was standardized with an empty vector. Firefly luciferase activities were normalized by Renilla luciferase activities. Each value is the mean ± S.E. (n = 5–6 independent experiments).
FIGURE 8.
FIGURE 8.
α1-AR signaling down-regulated Bmp4 mRNA in MC3T3-E1 cells. MC3T3-E1 cells were treated with 10 μm PHE for 4, 8, and 12 h, harvested, and then processed for real-time qRT-PCR. Each value represents the mean ± S.E. of three separate experiments. *, p < 0.05, significantly different from each control value obtained in MC3T3-E1 cells cultured in the absence of PHE.
FIGURE 9.
FIGURE 9.
α1-AR signaling regulated clock genes and Bmp4 in bone. The effect of the intraperitoneal administration of PHE at 10 μg/g on rhythmic expression of Bmal1, Per2, Nfil3, and Bmp4 mRNA in bone is shown. C57BL/6J mice were maintained under a 12:12-hour light/dark cycle for 2 weeks, and then PHE was administered intraperitoneally at ZT0. Total RNA was isolated from the femurs (cancellous bone) of saline-treated and PHE-treated C57BL/6J mice. The mRNA levels of Bmal1, Per2, Nfil3, and Bmp4 were determined by real-time qRT-PCR using specific primers. Each value is the mean ± S.E. (n = 3 or 4 in each group). *, p < 0.05, significantly different from each control value.
FIGURE 10.
FIGURE 10.
α1-AR signaling regulated the promoter element binding of Nfil3 to the Bmp4 gene in MC3T3-E1 cells. A, schematic showing the three potential binding sites of the proximal D-box in the putative promoter element of the Bmp4 gene. Grey ovals indicate the sites that match consensus D-box element sequences in the mouse Bmp4 gene. PCR was performed using sequences found in the 5′ flanking region (−1906 to −1887 and −1777 to −1758) and the exon 1 region (+243 to +262 and +442 to +461) of the mouse Bmp4 gene as primers. B, ChIP assays with antibodies against Nfil3 from MC3T3-E1 cells. A representative image of ChIP agarose gel electrophoresis. Nfil3/E4BP4 occupancy of this promoter region of the Bmp4 gene was enriched in MC3T3-E1 cells. Chromatin was prepared from MC3T3-E1 cells and immunoprecipitated with anti-Nfil3, followed by PCR using primers from the Bmp4 promoter or exon 1 of the Bmp4 gene as a control. Ten percent of the input was loaded as a control. Anti-IgG antibodies were used as a control for specificity. PCR-amplified bands of the Bmp4 promoter (top panel) and exon 1 of the Bmp4 genes (bottom panel) in chromatin were precipitated by Nfil3 antibodies. IgG, nonimmune rabbit IgG; Nfil3, rabbit Nfil3 antibodies; Input, DNA input. C, PHE increased the promoter element binding of Nfil3/E4BP4 to the Bmp4 gene. ChIP analysis revealed the increased binding of Nfil3 to the binding site of the Bmp4 promoter element in MC3T3-E1 cells following the PHE treatments. Each value represents the mean ± S.E. of six separate experiments. *, p < 0.05, significantly different from the value obtained in MC3T3-E1 cells cultured in the absence of PHE.

Similar articles

Cited by

References

    1. Prinster S. C., Hague C, Hall R. A. (2005) Heterodimerization of G protein-coupled receptors: specificity and functional significance. Pharmacol. Rev. 7, 289–298 - PubMed
    1. Philipp M., Hein L. (2004) Adrenergic receptor knockout mice: distinct functions of 9 receptor subtypes. Pharmacol. Ther. 101, 65–74 - PubMed
    1. Wettschureck N., Offermanns S. (2005) Mammalian G proteins and their cell type specific functions. Physiol. Rev. 85, 1159–1204 - PubMed
    1. Takeda S., Elefteriou F., Levasseur R., Liu X., Zhao L., Parker K. L., Armstrong D., Ducy P., Karsenty G. (2002) Leptin regulates bone formation via the sympathetic nervous system. Cell 111, 305–317 - PubMed
    1. Togari A., Arai M., Kondo A. (2005) The role of the sympathetic nervous system in controlling bone metabolism. Expert Opin. Ther. Targets 9, 931–940 - PubMed

Publication types

MeSH terms