

Compositional biases among synonymous substitutions cause conflict between gene and protein trees for plastid origins
- PMID: 24795089
- PMCID: PMC4069611
- DOI: 10.1093/molbev/msu105
Compositional biases among synonymous substitutions cause conflict between gene and protein trees for plastid origins
Abstract
Archaeplastida (=Kingdom Plantae) are primary plastid-bearing organisms that evolved via the endosymbiotic association of a heterotrophic eukaryote host cell and a cyanobacterial endosymbiont approximately 1,400 Ma. Here, we present analyses of cyanobacterial and plastid genomes that show strongly conflicting phylogenies based on 75 plastid (or nuclear plastid-targeted) protein-coding genes and their direct translations to proteins. The conflict between genes and proteins is largely robust to the use of sophisticated data- and tree-heterogeneous composition models. However, by using nucleotide ambiguity codes to eliminate synonymous substitutions due to codon-degeneracy, we identify a composition bias, and dependent codon-usage bias, resulting from synonymous substitutions at all third codon positions and first codon positions of leucine and arginine, as the main cause for the conflicting phylogenetic signals. We argue that the protein-coding gene data analyses are likely misleading due to artifacts induced by convergent composition biases at first codon positions of leucine and arginine and at all third codon positions. Our analyses corroborate previous studies based on gene sequence analysis that suggest Cyanobacteria evolved by the early paraphyletic splitting of Gloeobacter and a specific Synechococcus strain (JA33Ab), with all other remaining cyanobacterial groups, including both unicellular and filamentous species, forming the sister-group to the Archaeplastida lineage. In addition, our analyses using better-fitting models suggest (but without statistically strong support) an early divergence of Glaucophyta within Archaeplastida, with the Rhodophyta (red algae), and Viridiplantae (green algae and land plants) forming a separate lineage.
Keywords: Archaeplastida; Cyanobacteria; origin of plastids; phylogeny.
© The Author 2014. Published by Oxford University Press on behalf of the Society for Molecular Biology and Evolution.
Figures
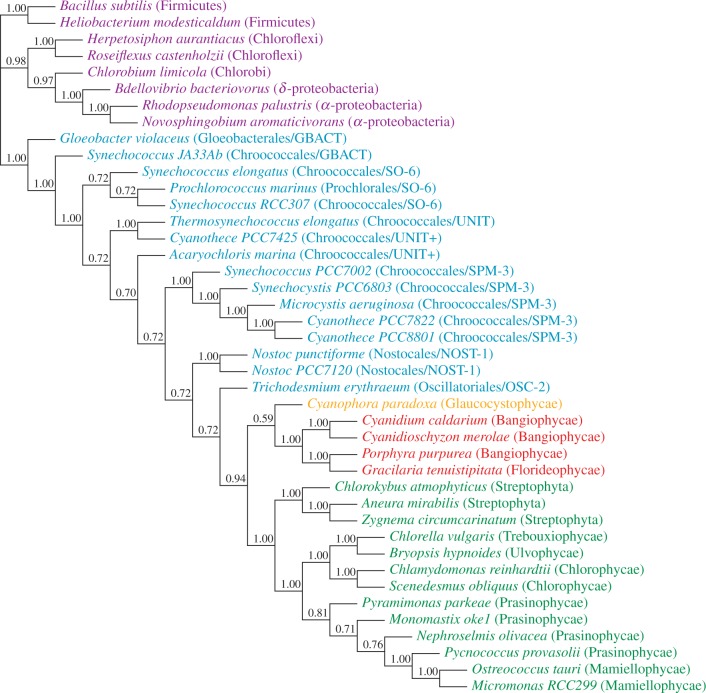
 ) bootstrap trees. Values above the branches are BPs. Colors indicate taxonomic groups (
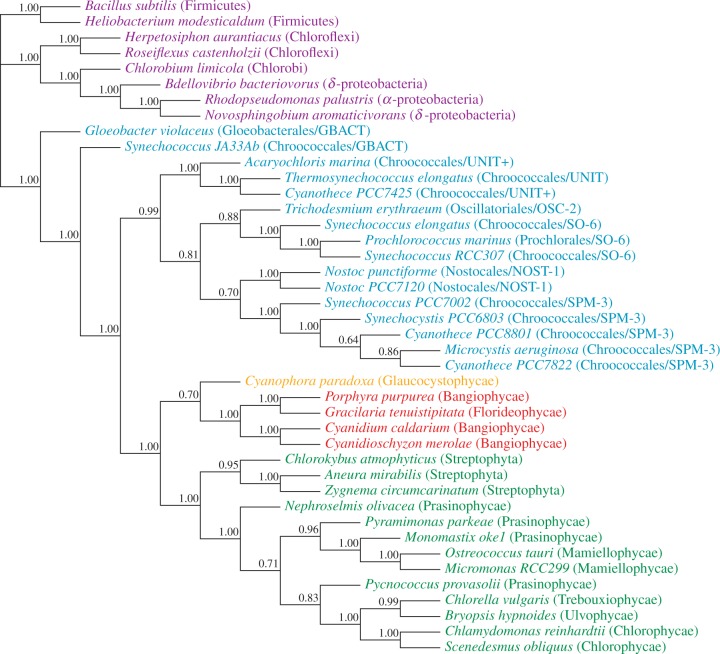
 ) bootstrap trees. Values above branches are BPs. Colors indicate taxonomic group (refer legend of fig. 1).
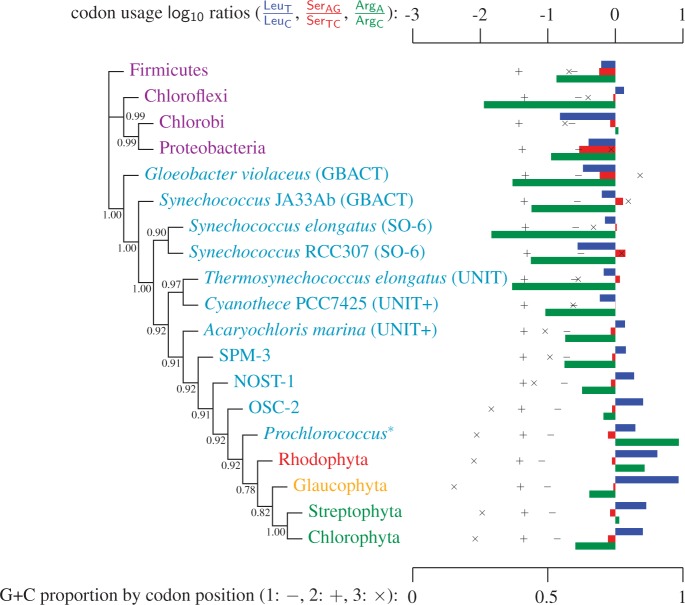
 ) bootstrap trees. Clades are labeled by their group label were possible. The codon usage bias and
  proportions at the three codon positions of the original “cg75” data set (i.e., without recoding) are presented to the right of the taxa (average values are given for summarized groups). This tree was chosen to display codon usage biases and G + C proportions because it seems to exemplify reconstruction errors induced by compositional effects. The topology of this tree somewhat correlates with composition and codon usages biases. Codon usage bias among Leu, Ser, and Arg is measured as the
  of the unbiased ratio between the usage of the two families of codons where the number of occurrences of codons of a family is divided by the number of possible codons in that family (2 or 4). Codon family labels:
  ,
,  ;
;  ,
,  ;
;  ,
,  ;
;  ,
,  ;
;  ,
,  ; and
; and  ,
,  . The codon bias representation is inspired by figure 1 of Inagaki and Roger (2006). Values above branches are BPs. Colors indicate taxonomic group (refer legend of fig. 1). *Prochlorococcus is an abbreviation of Prochlorococcus marinus (SO-6).
References
-
- Abascal F, Zardoya R, Posada D. ProtTest: selection of best-fit models of protein evolution. Bioinformatics. 2005;21(9):2104–2105. - PubMed
-
- Aitken A, Stanier RY. Characterization of peptidoglycan from the cyanelles of Cyanophora paradoxa. J Gen Microbiol. 1979;112(2):219–223.
-
- Akashi H, Kliman RM, Eyre-Walker A. Mutation pressure, natural selection, and the evolution of base composition in Drosophila. Genetica. 1998 102/103:49–60. - PubMed
-
- Averof M, Rokas A, Wolfe KH, Sharp PM. Evidence for a high-frequency of simultaneous double-nucleotide substitutions. Science. 2000;287(5456):1283–1386. - PubMed
Publication types
MeSH terms
Substances
LinkOut - more resources
Full Text Sources
Other Literature Sources
