. 2014 May 2;3(6):453-62.
doi: 10.1242/bio.20146601.

EphA receptors regulate prostate cancer cell dissemination through Vav2-RhoA mediated cell-cell repulsion

Affiliations

EphA receptors regulate prostate cancer cell dissemination through Vav2-RhoA mediated cell-cell repulsion

Jennifer Batson et al. Biol Open. .

Abstract

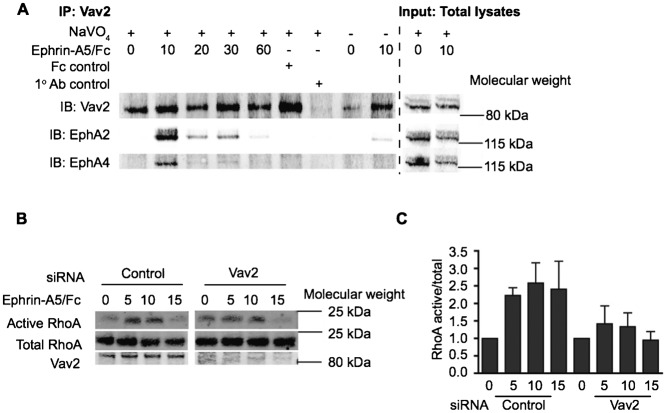
Metastatic prostate cancer cells display EphB receptor-mediated attraction when they contact stromal fibroblasts but EphA-driven repulsion when they contact one another. The impact of these 'social' interactions between cells during cancer cell invasion and the signalling mechanisms downstream of Eph receptors are unclear. Here we show that EphA receptors regulate prostate cancer cell dissemination in a 2D dispersal assay and in a 3D cancer cell spheroid assay. We show that EphA receptors signal via the exchange factor Vav2 to activate RhoA and that both Vav2 and RhoA are required for prostate cancer cell-cell repulsion. Furthermore, we find that in EphA2/EphA4, Vav2 or RhoA siRNA-treated cells, contact repulsion can be restored by partial microtubule destabilisation. We propose that EphA-Vav2-RhoA-mediated repulsion between contacting cancer cells at the tumour edge could enhance their local invasion away from the primary tumour.

Keywords: Cell migration; Contact inhibition of locomotion; Eph receptors; Prostate cancer; Rho GTPases; Vav2.


Conflict of interest statement

Competing interests: The authors have no competing interests to declare.

Figures

Fig. 1.
Fig. 1.. EphA2/EphA4 regulate prostate cancer cell dissemination and invasion.
(A) Representative images from time-lapse movies at 0 h and 24 h after removal of silicon inserts. Cells were serum starved and treated with HGF 24 h prior to insert removal. Red dotted line indicates the starting position of cells at 0 h. (B) Cells were tracked over 24 h from the edge of the cancer cell population. Each colour is a track of an individual cell. Enlargement of cell tracks to show meandering migration of EphA2 + EphA4 siRNA-treated cells. (C) Quantification of the total distance and (D) the direct distance between the first and last point relative to the total distance migrated. (E) Quantification of cell speed. (F) Immunoblotting to show knockdown efficiency. (G) Stills from timelapse movies show examples of cell–cell repulsion between control cells and lack of repulsion in EphA2 + EphA4 siRNA-treated cells (supplementary material Movies 1 and 2). 0 min is the time at which cells came into contact. Arrows indicate direction of migration. (H) Confocal images of phalloidin staining of control siRNA or EphA2 + EphA4 siRNA-treated prostate cancer spheroids 6 days after injection into collagen gels. (I) Invasion index was quantified by thresholding confocal images in imageJ to make a binary image and multiplying the average distance from the tumour spheroid by the number of invaded cells (Nyström et al., 2005). Data are from 4 independent experiments. One asterisk indicates P<0.05, two asterisks indicate P<0.01, N.S.; not significant difference as determined by an unpaired Student's t-test. AU represents arbitrary units. Scale bars: 100 µm (A), 50 µm (G), 200 µm (H).
Fig. 2.
Fig. 2.. RhoA is required for prostate cancer cell–cell repulsion.
(A) Representative images at the indicated timepoints from time-lapse movies of PC-3 cells treated with control or RhoA siRNA (supplementary material Movies 3 and 4). Cells were serum starved and treated with HGF 24 h prior to analysis of cell–cell collisions. 0 min is the time at which cells came into contact. (B) Contact acceleration indices (Cx) of free-moving (F) versus colliding (C) PC-3 cells transfected with control or RhoA siRNA oligonucleotides. (C) Quantification of contact time of PC-3 cells treated with the indicated siRNA oligonucleotides. (D) Quantification of migratory speed. (E) Immunoblotting to show knockdown efficiency with two RhoA siRNA oligonucleotides. (F) Repolarisation diagrams showing the position of newly formed leading edges (red spots) or maintenance of existing leading edges (green spots) after cell–cell collision. (G) Scaled cell-displacement vector diagrams of colliding cells. Scaled displacement of all cells before contact (thick red line) and individual cells after contact (black lines). Triple asterisks indicate P<0.001, two asterisks P<0.01, one asterisk P<0.05, N.S.; not significant, determined by a Mann–Whitney test. Data are from at least three independent experiments. Scale bars: 50 µm.
Fig. 3.
Fig. 3.. Vav2 is required for ephrin-A5/Fc-induced RhoA activation.
(A) PC-3 cells were treated with clustered ephrin-A5/Fc or Fc control and lysed after the indicated time-points with or without NaVO4 to inhibit tyrosine phosphatases. Vav2 was immunoprecipitated (IP) from lysates and immunoblotted (IB) for Vav2, EphA2 and EphA4 on immunoprecipitated lysate and on total input lysate. (B) PC-3 cells treated with ephrin-A5/Fc were lysed at the indicated time-points, followed by pulldown of RhoA GTP using Rhotekin Rho-binding domain beads. Proteins were resolved by SDS-PAGE and detected by immunoblotting. (C) Quantification of active RhoA relative to total RhoA. The intensity of the RhoA pulldown band was quantified using the LiCor Odyssey software relative to the RhoA intensity of total cell lysates for each timepoint to normalise active/total RhoA. Each timepoint is displayed relative to the untreated control (0 min) for control and Vav2 siRNA. Means and standard error of the means are shown. Cells were serum starved and treated with HGF 24 h prior to ephrin-A5/Fc stimulation.
Fig. 4.
Fig. 4.. Vav2 mediates prostate cancer cell–cell repulsion.
(A) Representative images from time-lapse movies of PC-3 cells treated with control or Vav2 siRNA (supplementary material Movies 5 and 6). Cells were serum starved and treated with HGF 24 h prior to analysis of cell–cell collisions. (B) Contact acceleration indices (Cx) of free moving (F) and colliding (C) cells treated with control siRNA or Vav2 siRNA. (C) Quantification of migratory speed. (D) Immunoblotting shows knockdown efficiency with two Vav2 siRNA oligonucleotides. (E) Repolarisation diagrams showing the position of newly formed leading edges (red spots) or maintenance of existing leading edges (green spots) after cell–cell collision. (F) Scaled cell-displacement vector diagrams of colliding cells. Scaled displacement of all cells before contact (thick red line) and individual cells after contact (black lines). One asterisk indicates P<0.05, triple asterisks indicate P<0.001, N.S.; not significant, determined by a Mann–Whitney test for Cx values and a Student's t-test for contact time. Data are from at least three independent experiments. Scale bar: 50 µm.
Fig. 5.
Fig. 5.. EphA, Vav2 and RhoA signalling affects microtubule stability.
(A) Representative confocal images of total tubulin or stable tubulin (Glu-tubulin) in PC-3 cells treated with control or RhoA siRNA and ephrin-A5/Fc or Fc control. (B) Quantification of the % of cells with stable microtubules with the indicated treatments. (C) Representative images of staining for the microtubule tip marker EB1 in control or RhoA siRNA cells treated with ephrin-A5/Fc or Fc control. (D) Quantification of the EB1 comet length with the indicated treatments. Data are from 3 independent experiments. One asterisk indicates P<0.05, two asterisks indicate P<0.01, three asterisks indicate P<0.001, N.S.; not significant. Cells were serum starved and treated with HGF 24 h prior to ephrin-A5/Fc stimulation. Scale bars: 50 µm (A), 10 µm (C), 2 µm (C, inset).
Fig. 6.
Fig. 6.. Partial destabilisation of microtubules rescues cell–cell repulsion in EphA2/EphA4, Vav2 or RhoA siRNA-treated PC-3 cells.
(A) Representative stills from time-lapse movies of PC-3 cells treated with control or Vav2 siRNA and DMSO or Nocodazole (10 nM) (supplementary material Movies 7–10). Cells were serum starved and treated with HGF 24 h prior to analysis of cell–cell collisions. (B) Contact acceleration indices (Cx) of free-moving (F) versus colliding (C) cells with the indicated siRNA treatments and DMSO or Nocodazole treatment. Two asterisks indicate P<0.01, triple asterisks indicate P<0.001, N.S.; not significant, determined by a Mann–Whitney test. Data are from at least three independent experiments. Arrows indicate the direction of migration. Scale bar: 50 µm.

References

    1. Abe K., Rossman K. L., Liu B., Ritola K. D., Chiang D., Campbell S. L., Burridge K., Der C. J. (2000). Vav2 is an activator of Cdc42, Rac1, and RhoA. J. Biol. Chem. 275, 10141–10149 10.1074/jbc.275.14.10141 - DOI - PubMed
    1. Abercrombie M. (1970). Contact inhibition in tissue culture. In Vitro 6, 128–142 10.1007/BF02616114 - DOI - PubMed
    1. Abercrombie M. (1979). Contact inhibition and malignancy. Nature 281, 259–262 10.1038/281259a0 - DOI - PubMed
    1. Abercrombie M., Heaysman J. E. (1954). Observations on the social behaviour of cells in tissue culture. II. Monolayering of fibroblasts. Exp. Cell Res. 6, 293–306 10.1016/0014-4827(54)90176-7 - DOI - PubMed
    1. Anear E., Parish R. W. (2012). The effects of modifying RhoA and Rac1 activities on heterotypic contact inhibition of locomotion. FEBS Lett. 586, 1330–1335 10.1016/j.febslet.2012.03.044 - DOI - PubMed