. 2014 Jul;80(14):4162-83.
doi: 10.1128/AEM.00486-14. Epub 2014 May 2.

Functional genomic characterization of virulence factors from necrotizing fasciitis-causing strains of Aeromonas hydrophila

Affiliations

Functional genomic characterization of virulence factors from necrotizing fasciitis-causing strains of Aeromonas hydrophila

Christopher J Grim et al. Appl Environ Microbiol. 2014 Jul.

Abstract

The genomes of 10 Aeromonas isolates identified and designated Aeromonas hydrophila WI, Riv3, and NF1 to NF4; A. dhakensis SSU; A. jandaei Riv2; and A. caviae NM22 and NM33 were sequenced and annotated. Isolates NF1 to NF4 were from a patient with necrotizing fasciitis (NF). Two environmental isolates (Riv2 and -3) were from the river water from which the NF patient acquired the infection. While isolates NF2 to NF4 were clonal, NF1 was genetically distinct. Outside the conserved core genomes of these 10 isolates, several unique genomic features were identified. The most virulent strains possessed one of the following four virulence factors or a combination of them: cytotoxic enterotoxin, exotoxin A, and type 3 and 6 secretion system effectors AexU and Hcp. In a septicemic-mouse model, SSU, NF1, and Riv2 were the most virulent, while NF2 was moderately virulent. These data correlated with high motility and biofilm formation by the former three isolates. Conversely, in a mouse model of intramuscular infection, NF2 was much more virulent than NF1. Isolates NF2, SSU, and Riv2 disseminated in high numbers from the muscular tissue to the visceral organs of mice, while NF1 reached the liver and spleen in relatively lower numbers on the basis of colony counting and tracking of bioluminescent strains in real time by in vivo imaging. Histopathologically, degeneration of myofibers with significant infiltration of polymorphonuclear cells due to the highly virulent strains was noted. Functional genomic analysis provided data that allowed us to correlate the highly infectious nature of Aeromonas pathotypes belonging to several different species with virulence signatures and their potential ability to cause NF.


Figures

FIG 1
FIG 1
NJ tree of strains built by using 2,514 conserved full-length predicted proteins concatenated together. The distance was calculated with PROTDIST (55, 56). The scale bar shows 0.001 substitution per site. There was strong bootstrap support for the tree, with all but three branches having 100/100 replicate congruence. The three branches with >50% but <100% support were all internal branches.
FIG 2
FIG 2
(A) Genetic organization of the act gene locus from Aeromonas species. Gene locus schematics are drawn to relative scale. Genes are depicted as follows. Gray arrows represent conserved flanking genes, i.e., that for the hypothetical protein FIG 00361276 (5′ or upstream) and thiC (3′ or downstream). Diagonally striped arrows represent the act gene. The white arrow represents hypothetical protein-encoding genes (nonhomologous). The vertically striped arrows represent putative arylsulfate sulfotransferase-encoding genes. The horizontally striped arrow represents the gene for a putative glutathionylspermidine synthase, group 1 (EC 6.3.1.8). The regions between the gene schematics show homology, with darker red representing higher homology and lighter red indicating regions of lower homology, while colorless regions are not homologous and indicate insertions or deletions. The gene locus of strain ATCC 7966T is also representative of SSU, NF1, and E1, while Riv3 is also representative of E2. (B) Phylogenetic relationship of the act gene locus, including conserved flanking genes, i.e., that for hypothetical protein FIG 00361276 (5′ or upstream) and thiC (3′ or downstream), act, and other gene insertions, in Aeromonas. (C) Phylogenetic relationship of the act gene. The evolutionary reconstructions were inferred by using the NJ method. The bootstrap consensus tree was inferred from 1,000 replicates. Evolutionary distance is shown as the number of nucleotide differences.
FIG 3
FIG 3
Biofilm formation by Aeromonas strains was quantified on polystyrene plastic after 24 h of incubation at 37°C by CV staining. Three independent experiments were performed, and the arithmetic means ± standard deviations were plotted. An asterisk indicates a P value of ≤0.0001 as determined by one-way ANOVA. OD, optical density.
FIG 4
FIG 4
Swimming motility assay of various Aeromonas strains. We used 60-mm petri plates to determine swimming motility. Three independent experiments were performed, and the arithmetic means ± standard deviations were plotted. An asterisk indicates a P value of ≤0.0001 as determined by one-way ANOVA.
FIG 5
FIG 5
Swarming motility assay of various Aeromonas strains. We used 60-mm petri plates to determine swarming motility. Three independent experiments were performed, and the arithmetic means ± standard deviations were plotted. An asterisk indicates a P value of ≤0.0001 as determined by one-way ANOVA.
FIG 6
FIG 6
Production and secretion of Hcp, AexU, and ExoA by various strains of Aeromonas and P. aeruginosa as determined by Western blotting. While only SSU and Riv2 secreted Hcp into the supernatant, the Hcp protein was identified in the cell pellets of all of the other strains studied, except for A. hydrophila ATCC 7966T (A). Isolates SSU, NF1, and NF2 produced AexU (B), while ExoA was secreted by isolates SSU and NF2, as well as by P. aeruginosa PA103 (C). Y. pestis (YP) served as a control. The molecular sizes of Hcp, AexU, and ExoA are indicated.
FIG 7
FIG 7
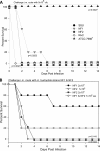
Virulence of various Aeromonas strains in a septicemic-mouse model of infection. Swiss-Webster mice (n = 6 to 23) were infected with a dose of 5 × 10⁷ CFU of the strains shown by the i.p. route. The animals were monitored for death for 14 days. The data were statistically analyzed by using the Kaplan-Meier survival estimate, and the actual P values are presented. The number of animals used for each strain is shown in parentheses.
FIG 8
FIG 8
Percent survival of mice after infection with various Aeromonas isolates by the i.m. route. (A) Animals were infected with isolate SSU, NF1, NF2, Riv2, or ATCC 7966T at 5 × 10⁸ CFU/mouse and monitored for death for 14 days. (B) Animals were infected with NF1 and NF2 at the lower doses indicated or with a mixture of these two isolates at 1 × 10⁸ CFU each per mouse. Isolates SSU, NF1, NF2, and Riv2 were statistically significantly more virulent than avirulent A. hydrophila strain ATCC 7966T (A). Likewise, NF2 at both the doses was statistically significantly more virulent than NF1 (B). The data were statistically analyzed by using Kaplan-Meier survival estimates, and the actual P values are presented.
FIG 9
FIG 9
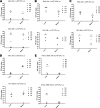
Bacterial dissemination patterns for various Aeromonas isolates in a mouse model of NF. Mice (n = 5) were infected by the i.m. route with the dose of isolate SSU (A), Riv2 (B), NF2 (C), NF1 (D), or ATCC 7966T (E) indicated. At 24 or 48 h p.i., the spleen and liver were aseptically removed from each mouse, homogenized, and subjected to bacterial colony counting. M1 to M5 represent individual mice, and some groups have fewer animals because of deaths p.i.
FIG 10
FIG 10
Gross pathological examination of leg muscle tissues after infection with A. dhakensis SSU and A. hydrophila NF1. At 24 (A) or 48 (B1 and B2) h p.i., leg tissues from animals infected with isolate SSU at 5 × 10⁸ CFU/mouse via the i.m. route were examined macroscopically. Note that the B2 animal expired at the time of examination. The other leg of the animal was given either PBS or LPS. Also, at 7 days p.i. (C), the animals that survived infection with strain NF1 at 2 × 10⁸ CFU/mouse were sacrificed and the leg tissues were grossly observed for lesions. Only representative animals are shown.
FIG 11
FIG 11
Histopathological examination of mouse leg muscle tissues after infection by the i.m. route with various Aeromonas isolates. (A) Leg muscle tissues collected at 48 h p.i. from mice injected with strain ATCC 7966T, NF1, SSU, or Riv2 (at a dose of 5 × 10⁸ CFU/mouse for ATCC 7966T and NF1 or 1 × 10⁸ for SSU and Riv2) or with PBS (negative control) were processed for histopathological analysis and observed under a microscope after staining with H&E. A star symbols denote infiltration of PMNs, while squares, rectangles, and long or short arrows show necrotic lesions in skeletal muscle tissues with loss of characteristic striations. Triangles indicate edematous swelling. Each of these images represents a group of five samples. (B) Animals were infected with highly virulent isolate NF2 at 5 × 10⁶ or 1 × 10⁷ CFU/mouse. An arrow indicates skeletal muscle necrosis, and an asterisk indicates infiltration of PMNs. An image representative of five mice is shown. Magnifications (for panels A and B), 100× (top rows) and 400× (bottom rows).
FIG 12
FIG 12
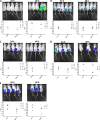
Bioluminescent imaging and corresponding bacterial loads of harvested livers and spleens infected with luminescent Aeromonas strains SSU (A), NF1 (B), ATCC 7966T (C) Riv2 (5 × 10⁷ CFU) (D), and Riv2 (1 × 10⁸ CFU) (E). Infected mice (n = 5) were imaged at 24 and 48 h p.i. and used for colony counting. For isolates SSU, NF1, and ATCC 7966T, the challenge dose was 5 × 10⁸ CFU/mouse by the i.m. route. The CFU are reported for whole organs derived from colony plate counts.

Similar articles

Cited by

References

    1. Von Graevenitz A, Mensch AH. 1968. The genus Aeromonas in human bacteriology—report of 30 cases and review of the literature. N. Engl. J. Med. 278:245–249. 10.1056/NEJM196802012780504 - DOI - PubMed
    1. Presley SM, Rainwater TR, Austin GP, Platt SG, Zak JC, Cobb GP, Marsland EJ, Tian K, Zhang B, Anderson TA, Cox SB, Abel MT, Leftwich BD, Huddleston JR, Jeter RM, Kendall RJ. 2006. Assessment of pathogens and toxicants in New Orleans, LA following Hurricane Katrina. Environ. Sci. Technol. 40:468–474. 10.1021/es052219p - DOI - PubMed
    1. Chen PL, Wu CJ, Chen CS, Tsai PJ, Tang HJ, Ko WC. 16 November 2013. A comparative study of clinical Aeromonas dhakensis and Aeromonas hydrophila isolates in southern Taiwan: A. dhakensis is more predominant and virulent. Clin. Microbiol. Infect. 10.1111/1469-0691.12456 - DOI - PubMed
    1. Palú AP, Gomes LM, Miguel MA, Balassiano IT, Queiroz ML, Freitas-Almeida AC, de Oliveira SS. 2006. Antimicrobial resistance in food and clinical Aeromonas isolates. Food Microbiol. 23:504–509. 10.1016/j.fm.2005.07.002 - DOI - PubMed
    1. Chauret C, Volk C, Creason R, Jarosh J, Robinson J, Warnes C. 2001. Detection of Aeromonas hydrophila in a drinking-water distribution system: a field and pilot study. Can. J. Microbiol. 47:782–786. 10.1139/w01-070 - DOI - PubMed

Publication types

MeSH terms