. 2014 Jul 1;130(1):27-34.
doi: 10.1161/CIRCULATIONAHA.113.008285. Epub 2014 May 2.

Impact of farnesylation inhibitors on survival in Hutchinson-Gilford progeria syndrome

Collaborators, Affiliations

Impact of farnesylation inhibitors on survival in Hutchinson-Gilford progeria syndrome

Leslie B Gordon et al. Circulation. .

Abstract

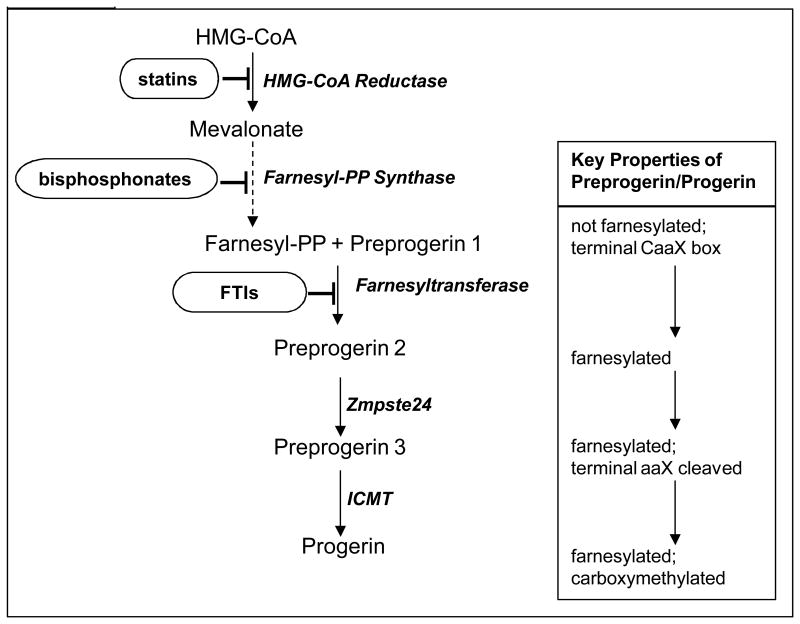
Background: Hutchinson-Gilford progeria syndrome is an ultrarare segmental premature aging disease resulting in early death from heart attack or stroke. There is no approved treatment, but starting in 2007, several recent single-arm clinical trials administered inhibitors of protein farnesylation aimed at reducing toxicity of the disease-producing protein progerin. No study assessed whether treatments influence patient survival. The key elements necessary for this analysis are a robust natural history of survival and comparison with a sufficiently large patient population that has been treated for a sufficient time period with disease-targeting medications.

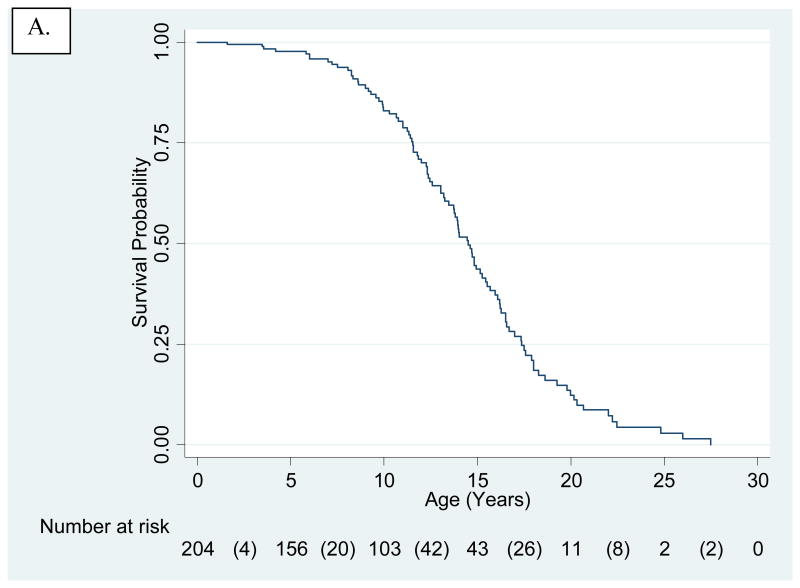
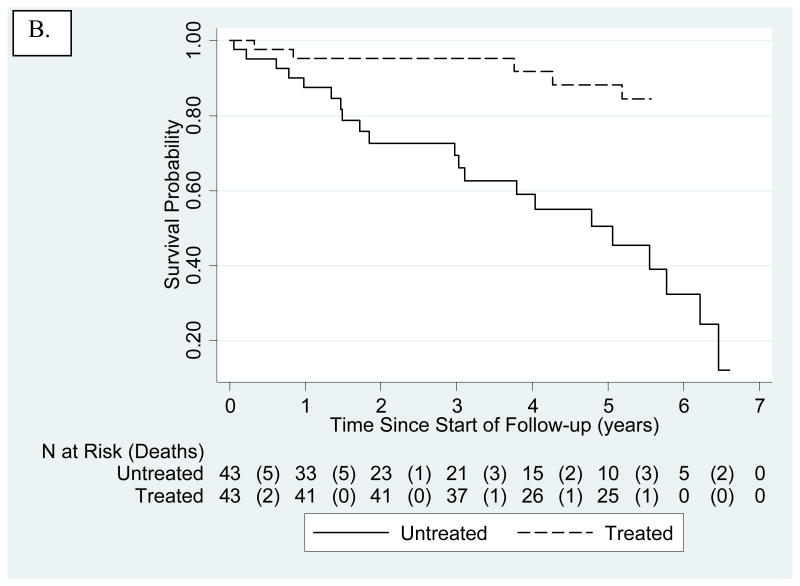
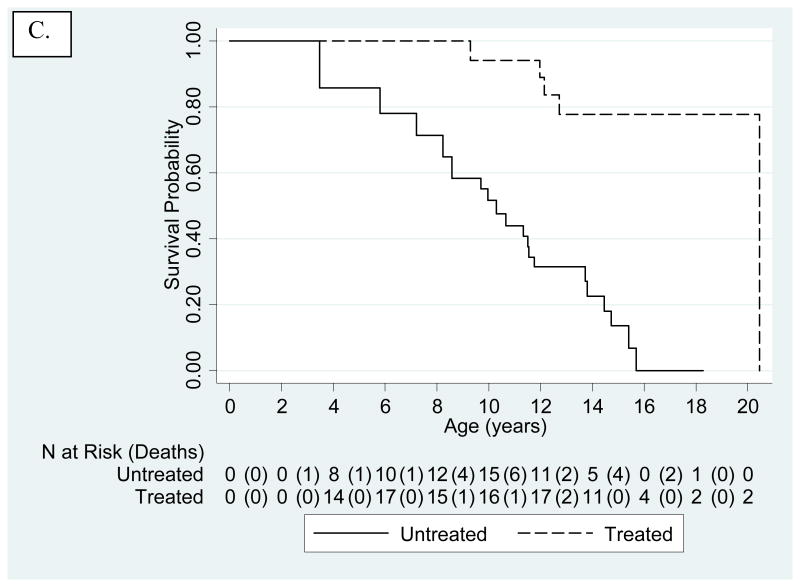
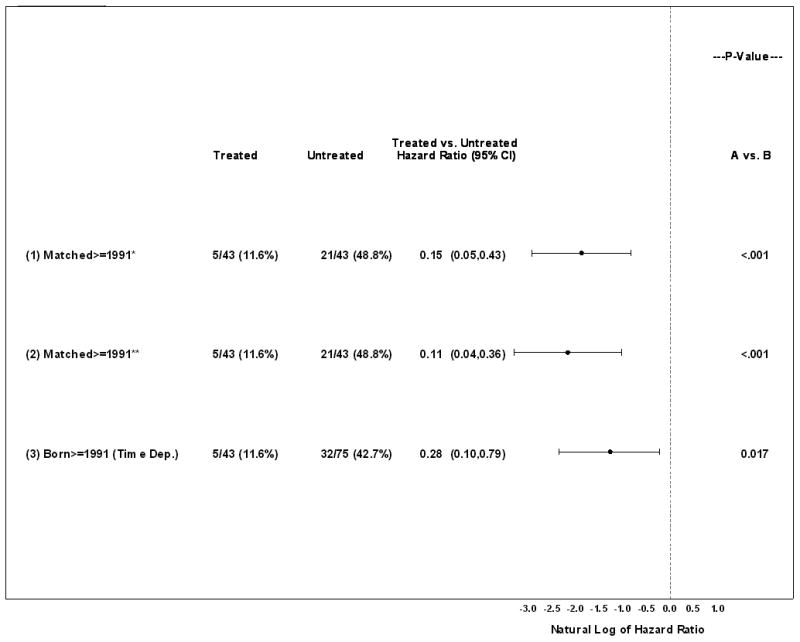
Methods and results: We generated Kaplan-Meier survival analyses for the largest untreated Hutchinson-Gilford progeria syndrome cohort to date. Mean survival was 14.6 years. Comparing survival for treated versus age- and sex-matched untreated cohorts, hazard ratio was 0.13 (95% confidence interval, 0.04-0.37; P<0.001) with median follow-up of 5.3 years from time of treatment initiation. There were 21 of 43 deaths in untreated versus 5 of 43 deaths among treated subjects. Treatment increased mean survival by 1.6 years.

Conclusions: This study provides a robust untreated disease survival profile that can be used for comparisons now and in the future to assess changes in survival with treatments for Hutchinson-Gilford progeria syndrome. The current comparisons estimating increased survival with protein farnesylation inhibitors provide the first evidence of treatments influencing survival for this fatal disease.

Clinical trial registration url: http://www.clinicaltrials.gov. Unique Indentifiers: NCT00425607, NCT00879034, and NCT00916747.

Keywords: Kaplan-Meier estimate; aging; atherosclerosis; lamins; lonafarnib; prenylation; progeria.


Conflict of interest statement

Conflict of Interest Disclosures: Author LBG is the parent of a child who participated in the study.

Figures

Figure 1
Figure 1
Current HGPS treatment strategies aimed at preventing formation of progerin protein by inhibiting post-translational farnesylation of preprogerin. Enzymes facilitating each step are italicized. Dashed line indicates multiple steps in pathway not shown. Medications aimed at inhibiting protein farnesylation are circled. ICMT = isoprenylcysteine carboxyl methyltransferase
Figure 2
Figure 2
Kaplan-Meier-survival estimates for untreated and treated HGPS cohorts. The number of patients at risk are presented below the x-axis. Numbers in parentheses are number of deaths during that time interval. A. Untreated cohort. Treated subjects were included, but censored at age of treatment initiation. Mean and median survival were 14.6 and 14.5 years, respectively. B. Kaplan-Meier-survival Estimates Comparing Untreated (solid line) to Treated (dashed line) Cohorts Using Matched Analysis (age-adjusted P<0.001) where Time 0 on the x-axis (i.e., beginning of patient being at risk) is defined for each matched pair as the age of treatment initiation for the treated patient in the matched pair. C. Kaplan-Meier-survival Estimates Comparing Untreated (solid line) to Treated (dashed line) Cohorts Using Matched Analysis (unadjusted P<0.001) where Time 0 on the x-axis (i.e., beginning of patient follow-up) is defined as patient birth and subject becomes at risk at the age of treatment initiation for the treated patient in the matched pair.
Figure 2
Figure 2
Kaplan-Meier-survival estimates for untreated and treated HGPS cohorts. The number of patients at risk are presented below the x-axis. Numbers in parentheses are number of deaths during that time interval. A. Untreated cohort. Treated subjects were included, but censored at age of treatment initiation. Mean and median survival were 14.6 and 14.5 years, respectively. B. Kaplan-Meier-survival Estimates Comparing Untreated (solid line) to Treated (dashed line) Cohorts Using Matched Analysis (age-adjusted P<0.001) where Time 0 on the x-axis (i.e., beginning of patient being at risk) is defined for each matched pair as the age of treatment initiation for the treated patient in the matched pair. C. Kaplan-Meier-survival Estimates Comparing Untreated (solid line) to Treated (dashed line) Cohorts Using Matched Analysis (unadjusted P<0.001) where Time 0 on the x-axis (i.e., beginning of patient follow-up) is defined as patient birth and subject becomes at risk at the age of treatment initiation for the treated patient in the matched pair.
Figure 3
Figure 3
Hazard ratios (HRs) comparing untreated to treated cohorts using matched analyses and time-dependent analysis for patients born on or after 1991. HRs and P-values were generated from Cox proportional hazards regression and adjusted for sex and continent. *For each matched pair, follow-up begins at time 0 defined as the age of treatment initiation for the treated patient in the matched pair; HR and P-value further adjusted for age at risk. **For each matched pair, follow-up begins at birth and patient is placed at risk at the age of treatment initiation for the treated patient in the matched pair; HR and P-value further adjusted for age at risk.

Comment in

References

    1. Hennekam RC. Hutchinson-gilford progeria syndrome: Review of the phenotype. Am J Med Genet A. 2006;140:2603–2624. - PubMed
    1. Olive M, Harten I, Mitchell R, Beers JK, Djabali K, Cao K, Erdos MR, Blair C, Funke B, Smoot L, Gerhard-Herman M, Machan JT, Kutys R, Virmani R, Collins FS, Wight TN, Nabel EG, Gordon LB. Cardiovascular pathology in hutchinson-gilford progeria: Correlation with the vascular pathology of aging. Arterioscler Thromb Vasc Biol. 2010;30:2301–2309. - PMC - PubMed
    1. Gerhard-Herman M, Smoot LB, Wake N, Kieran MW, Kleinman ME, Miller DT, Schwartzman A, Giobbie-Hurder A, Neuberg D, Gordon LB. Mechanisms of premature vascular aging in children with hutchinson-gilford progeria syndrome. Hypertension. 2012;59:92–97. - PMC - PubMed
    1. Ullrich NJ, Kieran MW, Miller DT, Gordon L, Cho YJ, Silvera VM, Giobbie-Hurder A, Neuberg D, Kleinman M. Neurologic features of hutchinson-gilford progeria syndrome after lonafarnib treatment. Neurology. 2013;81:427–430. - PMC - PubMed
    1. De Sandre-Giovannoli A, Bernard R, Cau P, Navarro C, Amiel J, Boccaccio I, Lyonnet S, Stewart CL, Munnich A, Le Merrer M, Levy N. Lamin a truncation in hutchinson-gilford progeria. Science. 2003;300:2055. - PubMed

Publication types

MeSH terms

Associated data