. 2014 Apr 16:8:66.
doi: 10.3389/fnins.2014.00066. eCollection 2014.

Prioritizing spatial accuracy in high-resolution fMRI data using multivariate feature weight mapping

Affiliations

Prioritizing spatial accuracy in high-resolution fMRI data using multivariate feature weight mapping

Johannes Stelzer et al. Front Neurosci. .

Abstract

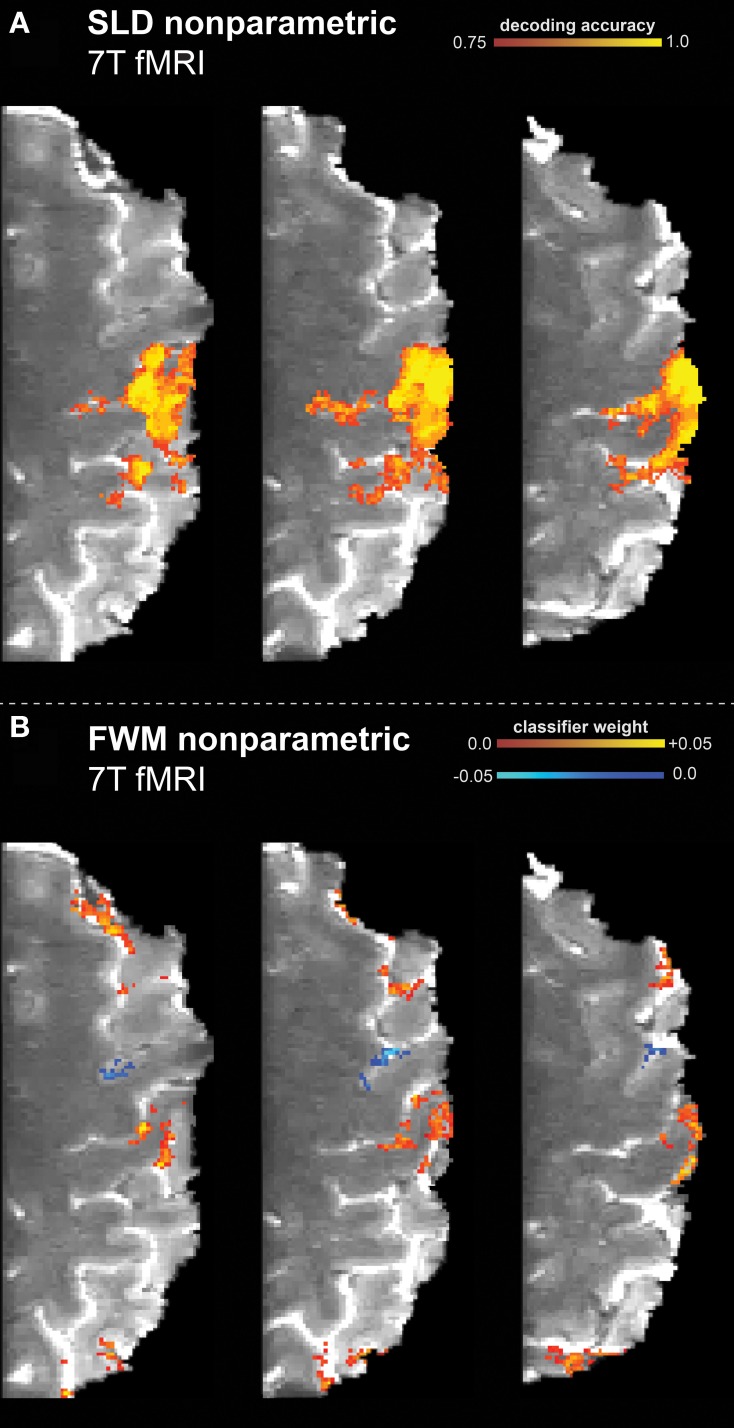
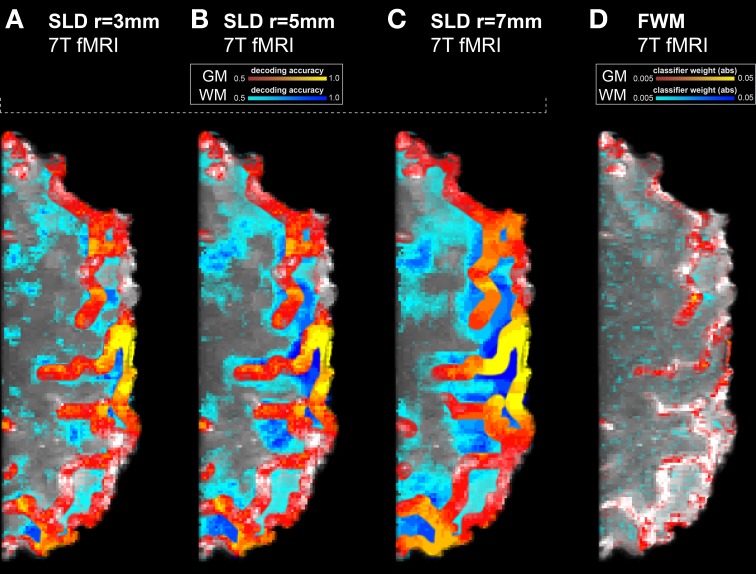
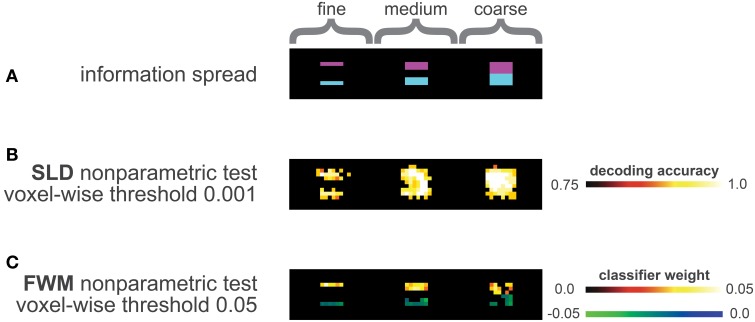
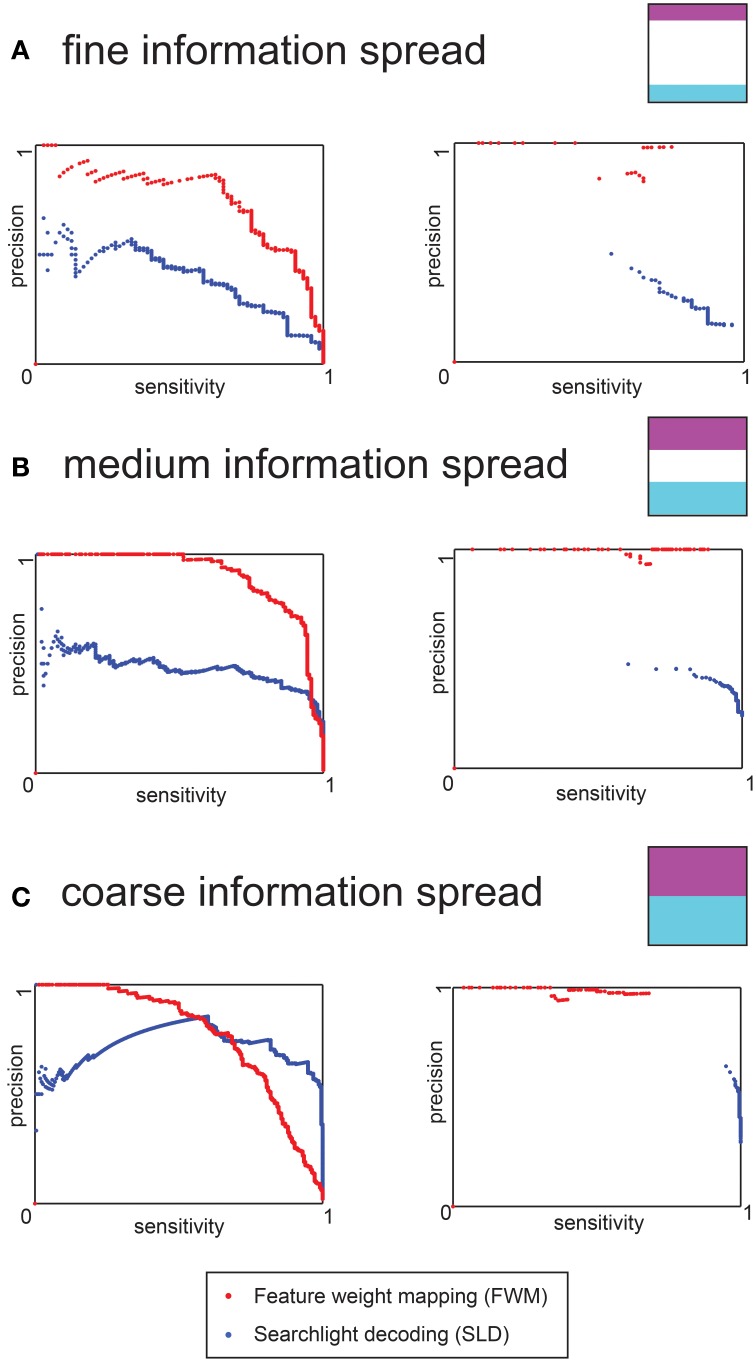
Although ultra-high-field fMRI at field strengths of 7T or above provides substantial gains in BOLD contrast-to-noise ratio, when very high-resolution fMRI is required such gains are inevitably reduced. The improvement in sensitivity provided by multivariate analysis techniques, as compared with univariate methods, then becomes especially welcome. Information mapping approaches are commonly used, such as the searchlight technique, which take into account the spatially distributed patterns of activation in order to predict stimulus conditions. However, the popular searchlight decoding technique, in particular, has been found to be prone to spatial inaccuracies. For instance, the spatial extent of informative areas is generally exaggerated, and their spatial configuration is distorted. We propose the combination of a non-parametric and permutation-based statistical framework with linear classifiers. We term this new combined method Feature Weight Mapping (FWM). The main goal of the proposed method is to map the specific contribution of each voxel to the classification decision while including a correction for the multiple comparisons problem. Next, we compare this new method to the searchlight approach using a simulation and ultra-high-field 7T experimental data. We found that the searchlight method led to spatial inaccuracies that are especially noticeable in high-resolution fMRI data. In contrast, FWM was more spatially precise, revealing both informative anatomical structures as well as the direction by which voxels contribute to the classification. By maximizing the spatial accuracy of ultra-high-field fMRI results, global multivariate methods provide a substantial improvement for characterizing structure-function relationships.

Keywords: MVPA; decoding; fMRI; nonparametric statistics; searchlight.


Figures

Figure 1
Figure 1
Results of the high resolution 7T finger tapping data set, classifying resting vs. finger tapping with touch. The non-parametric framework (including multiple comparison correction) had been applied to the searchlight decoding (SLD) and feature weight mapping (FWM) methods. (A) SLD method (diameter = 3.75 mm) with a voxel-wise threshold of p vox = 0.001 (one-sided). (B) FWM method, using a (two-sided) threshold of p vox = 0.05.
Figure 2
Figure 2
Results of the high resolution 7T finger tapping data set without multiple comparisons correction, using three searchlight radii and the feature weight mapping method. White matter voxels are displayed in false colors (by shifting the color hue by 180°). Hence the blue tones indicate false positivity. Dark blue tones indicate high decoding accuracies or high feature weights. (A) SLD with a radius of 3 mm. Already at this radius, substantial false positivity is visible on the surface of the cortex on the right side. On the left side, out-of-plane false positivity is visible, as searchlights centered in the selected slice pick up information from the slices below or above. (B) SLD with a radius of 5 mm. The levels of false positivity have increased throughout the entire volume. (C) With a radius of 7 mm, the SLD method results in substantially inaccurate depictions of true information content. (D) Feature weight mapping, to enhance the clarity of the representation only the absolute value of the weights is considered here. The highest (absolute) weights are found within gray matter, while the weights found in white matter are on a low level.
Figure 3
Figure 3
Analysis of the data simulation (A) Distribution of information, the three violet half-cubes contained class information for condition A, the three blue half-cubes contained class information for class B. In total, three distinct levels of geometry of information distribution were simulated, the leftmost half-cubes represented a fine information spread, the middle ones an intermediate level and the rightmost half-cubes a coarse information spread. (B) Results of SLD method corrected with the non-parametric framework (including multiple comparison correction), using a voxel-wise threshold of p vox = 0.001 (one-sided). (C) Results of FWM method corrected with the non-parametric framework (including multiple comparison correction) using a voxel-wise threshold of p vox = 0.05 (two-sided). The blue-green colors represent influence toward class B, the red colors for influence toward class A.
Figure 4
Figure 4
Precision-sensitivity curves for the three different levels of information distribution of the data simulation. The red dots represent the FWM method, and the blue dots the SLD method. (A) Precision- Sensitivity for a fine information spread. The left chart is based on uncorrected voxel p-values (derived from the permutation distribution), the right chart depicts results for the full non-parametric multiple comparison correction (B) Precision-Sensitivity for an intermediate distribution of information. The left and right charts are as above. (C) Precision-Sensitivity curve for a coarse information spread. The left and right charts are as above.
Figure 5
Figure 5
Schematic illustration of the searchlight induced inflations and spatial inaccuracies. (A) Searchlight shape (down-projection to 2D) with a 5-voxel diameter. The violet shaded voxels are located within the searchlight. (B) No voxels carry class information, except the center voxel featuring the green sphere labeled with the letter “i”: this voxel is the sole voxel carrying class information. As a result of the SLD procedure using searchlight decoding (A), many voxels are being labeled as informative (these voxels are depicted in orange). The inflating effect has previously been termed as “needle in the haystack effect” (Viswanathan et al., 2012). (C) Here, no voxels except the two voxels with the green sphere labeled with “i” carry class information. The information carried by one voxel, however, is sufficiently small so that a searchlight has to include both informative voxels in order to be labeled significant. Hence only the voxels in the middle, where the searchlight contains both informative voxels, are labeled informative, resulting in inaccurate and distorted information maps.

References

    1. Abdi H., Williams L. J. (2010). Principal component analysis. Wiley Interdiscip. Rev. Comput. Stat. 2, 433–459 10.1002/wics.101 - DOI
    1. Benjamini Y. (1999). A step-down multiple hypotheses testing procedure that controls the false discovery rate under independence. J. Stat. Plan. Infer. 82, 163–170 10.1016/S0378-3758(99)00040-3 - DOI - PubMed
    1. Chang C.-C., Lin C.-J. (2011). LIBSVM. ACM Trans. Intell. Syst. Technol. 2, 1–27 10.1145/1961189.1961199 - DOI
    1. Chen Y., Namburi P., Elliott L. T., Heinzle J., Soon C.-S., Chee M. W. L., et al. (2011). Cortical surface-based searchlight decoding. Neuroimage 56, 582–592 10.1016/j.neuroimage.2010.07.035 - DOI - PubMed
    1. Diedrichsen J., Wiestler T., Krakauer J. W. (2013). Two distinct ipsilateral cortical representations for individuated finger movements. Cereb. Cortex 23, 1362–1377 10.1093/cercor/bhs120 - DOI - PMC - PubMed

LinkOut - more resources