

Costs and Quality of Life in Diabetic Macular Edema: Canadian Burden of Diabetic Macular Edema Observational Study (C-REALITY)
- PMID: 24795818
- PMCID: PMC3984851
- DOI: 10.1155/2014/939315
Costs and Quality of Life in Diabetic Macular Edema: Canadian Burden of Diabetic Macular Edema Observational Study (C-REALITY)
Abstract
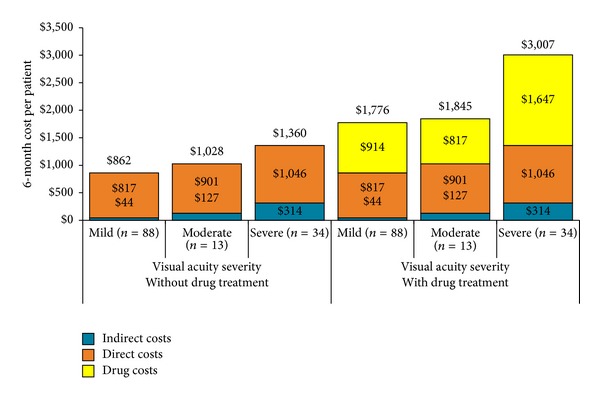
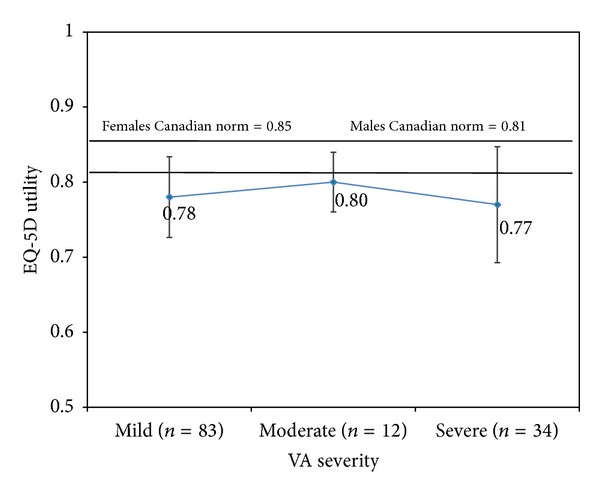
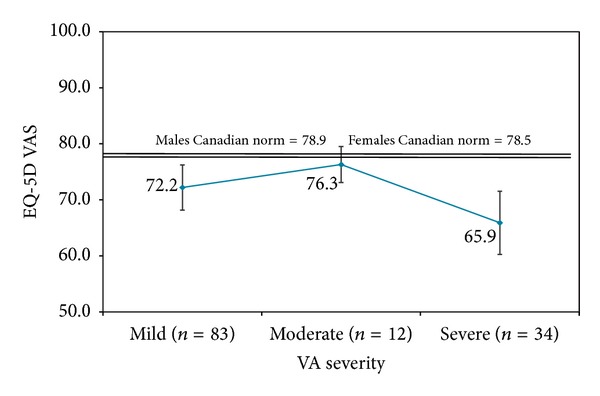
Purpose. To characterize the economic and quality of life burden of diabetic macular edema (DME) in Canadian patients. Patients and Methods. 145 patients with DME were followed for 6 months with monthly telephone interviews and medical chart reviews at months 0, 3, and 6. Visual acuity in the worst-seeing eye was assessed at months 0 and 6. DME-related healthcare costs were determined over 6 months, and vision-related (National Eye Institute Visual Functioning Questionnaire) and generic (EQ-5D) quality of life was assessed at months 0, 3, and 6. Results. Mean age of patients was 63.7 years: 52% were male and 72% had bilateral DME. At baseline, visual acuity was categorized as normal/mild loss for 63.4% of patients, moderate loss for 10.4%, and severe loss/nearly blind for 26.2%. Mean 6-month DME-related costs/patient were as follows: all patients (n = 135), $2,092; normal/mild loss (n = 88), $1,776; moderate loss (n = 13), $1,845; and severe loss/nearly blind (n = 34), $3,007. Composite scores for vision-related quality of life declined with increasing visual acuity loss; generic quality of life scores were highest for moderate loss and lowest for severe loss/nearly blind. Conclusions. DME-related costs in the Canadian healthcare system are substantial. Costs increased and vision-related quality of life declined with increasing visual acuity severity.
Figures

References
-
- Moss SE, Klein R, Klein BE. Ten-year incidence of visual loss in a diabetic population. Ophthalmology. 1994;101(6):1061–1070. - PubMed
-
- Ciulla TA, Amador AG, Zinman B. Diabetic retinopathy and diabetic macular edema: pathophysiology, screening, and novel therapies. Diabetes Care. 2003;26(9):2653–2664. - PubMed
-
- Johnson MW. Etiology and treatment of macular edema. American Journal of Ophthalmology. 2009;147(1):11.e1–21.e1. - PubMed
-
- The cost of vision loss in Canada: summary report, 2009, http://www.cnib.ca/eng/cnib%20document%20library/research/summaryreport_....
LinkOut - more resources
Full Text Sources
Other Literature Sources
