Quantitative (99m)Tc DTPA renal transplant scintigraphic parameters: assessment of interobserver agreement and correlation with graft pathologies
- PMID: 24795835
- PMCID: PMC3999401
Quantitative (99m)Tc DTPA renal transplant scintigraphic parameters: assessment of interobserver agreement and correlation with graft pathologies
Abstract
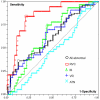
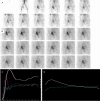
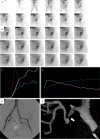
Various (99m)Tc DTPA scintigraphic quantitative parameters for renal graft function assessment have been recommended, but none is universally accepted. In this study, 439 dynamic renal transplant scintigraphies (DRTS) were retrospectively analysed. In the first set of studies, four observers analysed the 47 random DRTS and interobserver agreement of eleven derived parameters was assessed. In the other set of studies, 181 instances of DRTS, performed on 127 recipients with renal biopsies within five days of each other were selected for correlation with pathology. Hilson's Perfusion index (HI), ΔP, P:Pl, P:U & T10 were selected for this analysis. The pathologies were categorized into renal vascular compromise (RVC; n = 20), acute tubular necrosis (ATN; n = 40), vascular rejection (VR; n = 34), interstitial rejection (IR; n = 33), normal (NOR; n = 36) and unclassified pathologies (n = 18). A majority of the parameters showed good Intraclass correlation (ICC). HI differentiated well between grafts with RVC and the remainder of the study cohort, (p < 0.0001; AUC = 0.84); at a cut-off > 278, it had 84% sensitivity and 78% specificity (Likelihood ratio = 3.8). At < 278, it had 98% 'negative' predictive value for RVC. HI also showed reasonable association with VR (p = 0.02; AUC = 0.62) and IR (p = 0.009; AUC = 0.65). However, significant overlap of HI values between various subgroups was noted. Other parameters had good ICC but were not effective in differentiating graft pathologies. Of the measured parameters, only HI proved to be useful for the pathological assessment, particularly in the identification of vascular compromise. This parameter, however, has lower specificity in differentiating the other pathologies.
Keywords: Acute tubular necrosis; Hilson’s index; interobserver agreement; quantitative renal transplant DTPA scintigraphy; rejection; renal artery stenosis; renal graft.
Figures


Similar articles
-
Quantitative Tc-99m DTPA renal transplant scintigraphy predicts graft survival in the very early postoperative period.Nucl Med Commun. 2012 Dec;33(12):1292-9. doi: 10.1097/MNM.0b013e328359db96. Nucl Med Commun. 2012. PMID: 23027383
-
Quantitative scintigraphic parameters for the assessment of renal transplant patients.Eur J Radiol. 1998 Oct;28(3):256-69. doi: 10.1016/s0720-048x(97)00179-4. Eur J Radiol. 1998. PMID: 9881262 Review.
-
Value of early diethylentriamine penta-acetic acid renograms in predicting late allograft outcomes.Transplant Proc. 2013;45(10):3505-7. doi: 10.1016/j.transproceed.2013.09.023. Transplant Proc. 2013. PMID: 24314943
-
Early predictive value of baseline renal transplant scintigraphy in pediatric patients.Nucl Med Commun. 2018 Oct;39(10):901-907. doi: 10.1097/MNM.0000000000000892. Nucl Med Commun. 2018. PMID: 30086076
-
Renographic indices for evaluation of changes in graft function.Eur J Nucl Med. 1998 Nov;25(11):1575-86. doi: 10.1007/s002590050338. Eur J Nucl Med. 1998. PMID: 9799356 Review.
Cited by
-
Scintigraphic texture analysis for assessment of renal allograft function.Pol J Radiol. 2018 Jan 18;83:e1-e10. doi: 10.5114/pjr.2018.74956. eCollection 2018. Pol J Radiol. 2018. PMID: 30038672 Free PMC article.
-
Using Post Transplant 1 Week Tc-99m DPTA Renal Scan as Another Method for Predicting Renal Graft Failure.Open Med (Wars). 2019 Jun 17;14:509-515. doi: 10.1515/med-2019-0056. eCollection 2019. Open Med (Wars). 2019. PMID: 31259256 Free PMC article.
-
Efficient renal clearance of DNA tetrahedron nanoparticles enables quantitative evaluation of kidney function.Nano Res. 2019 Mar;12(3):637-642. doi: 10.1007/s12274-019-2271-5. Epub 2018 Dec 28. Nano Res. 2019. PMID: 32055285 Free PMC article.
-
Non-invasive approaches in the diagnosis of acute rejection in kidney transplant recipients. Part I. In vivo imaging methods.Clin Kidney J. 2017 Feb;10(1):97-105. doi: 10.1093/ckj/sfw062. Epub 2016 Jul 28. Clin Kidney J. 2017. PMID: 28643821 Free PMC article. Review.
References
-
- Brown ED, Chen MY, Wolfman NT, Ott DJ, Watson NE Jr. Complications of renal transplantation: evaluation with US and radionuclide imaging. Radiographics. 2000;20:607–622. - PubMed
-
- Sorof JM, Vartanian RK, Olson JL, Tomlanovich SJ, Vincenti FG, Amend WJ. Histopathological concordance of paired renal allograft biopsy cores. Effect on the diagnosis and management of acute rejection. Transplantation. 1995;60:1215–1219. - PubMed
-
- Furness PN, Taub N. International variation in the interpretation of renal transplant biopsies: report of the CERTPAP Project. Kidney Int. 2001;60:1998–2012. - PubMed
-
- Nezami N, Tarzamni MK, Argani H, Nourifar M. Doppler ultrasonographic indices after renal transplantation as renal function predictors. Transplant Proc. 2008;40:94–99. - PubMed
-
- Irshad A, Ackerman S, Sosnouski D, Anis M, Chavin K, Baliga P. A review of sonographic evaluation of renal transplant complications. Curr Probl Diagn Radiol. 2008;37:67–79. - PubMed
LinkOut - more resources
Full Text Sources
Research Materials
