

Protein kinase C Beta in the tumor microenvironment promotes mammary tumorigenesis
- PMID: 24795864
- PMCID: PMC4006052
- DOI: 10.3389/fonc.2014.00087
Protein kinase C Beta in the tumor microenvironment promotes mammary tumorigenesis
Abstract
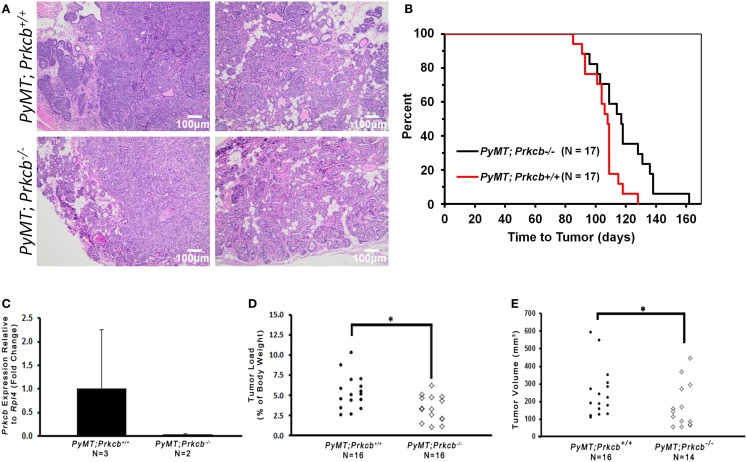
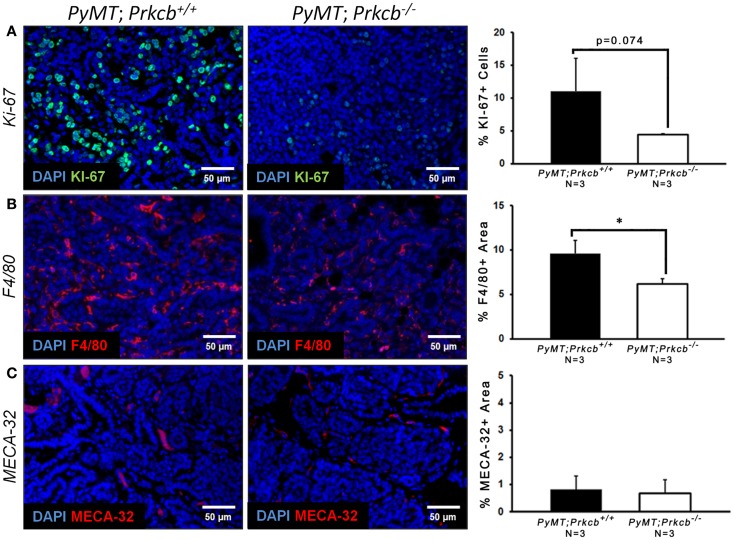
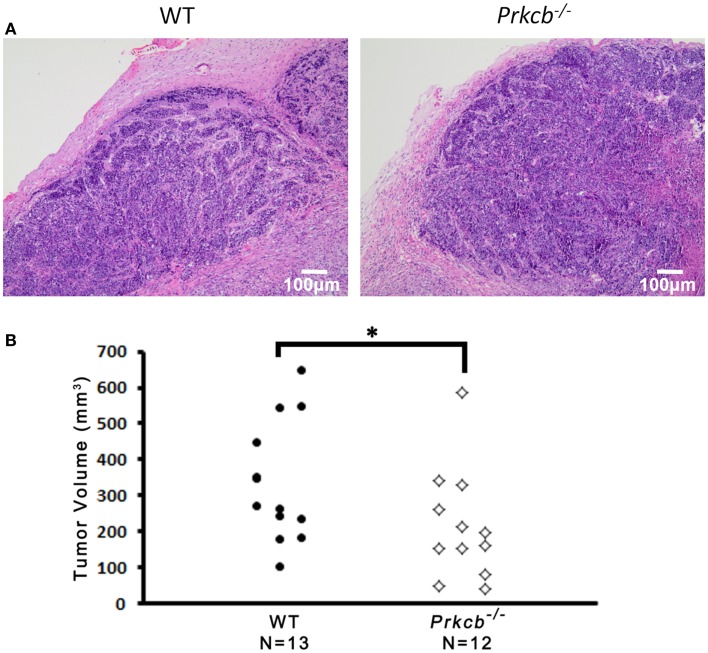
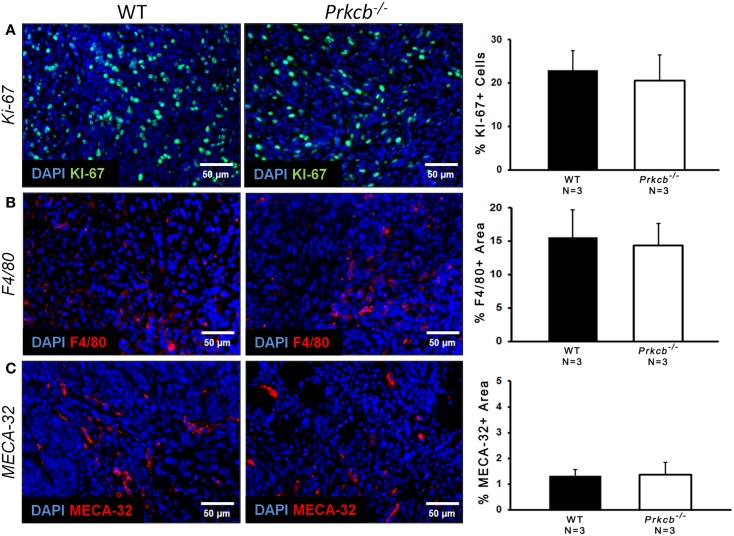
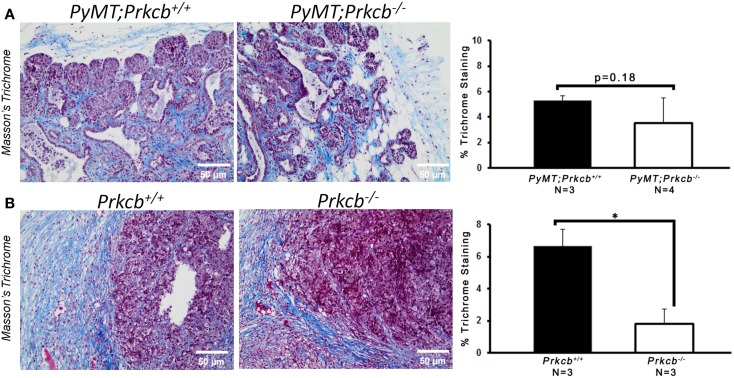
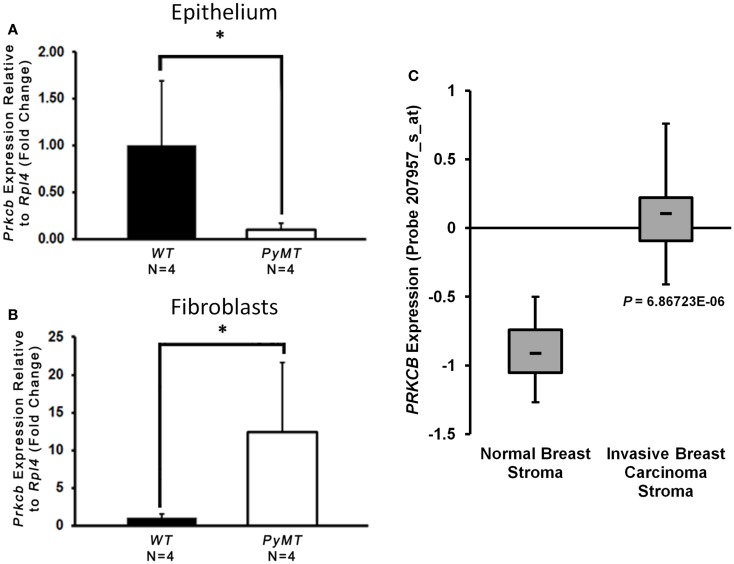
Protein kinase C beta (PKCβ) expression in breast cancer is associated with a more aggressive tumor phenotype, yet the mechanism for how PKCβ is pro-tumorigenic in this disease is still unclear. Interestingly, while it is known that PKCβ mediates angiogenesis, immunity, fibroblast function and adipogenesis, all components of the mammary tumor microenvironment (TME), no study to date has investigated whether stromal PKCβ is functionally relevant in breast cancer. Herein, we evaluate mouse mammary tumor virus-polyoma middle T-antigen (MMTV-PyMT) induced mammary tumorigenesis in the presence and absence of PKCβ. We utilize two model systems: one where PKCβ is deleted in both the epithelial and stromal compartments to test the global requirement for PKCβ on tumor formation, and second, where PKCβ is deleted only in the stromal compartment to test its role in the TME. MMTV-PyMT mice globally lacking PKCβ live longer and develop smaller tumors with decreased proliferation and decreased macrophage infiltration. Similarly, when PKCβ is null exclusively in the stroma, PyMT-driven B6 cells form smaller tumors with diminished collagen deposition. These experiments reveal for the first time a tumor promoting role for stromal PKCβ in MMTV-PyMT tumorigenesis. In corroboration with these results, PKCβ mRNA (Prkcb) is increased in fibroblasts isolated from MMTV-PyMT tumors. These data were confirmed in a breast cancer patient cohort. Combined these data suggest the continued investigation of PKCβ in the mammary TME is necessary to elucidate how to effectively target this signaling pathway in breast cancer.
Keywords: breast cancer; fibroblasts; mammary neoplasms (experimental); protein kinase C beta; stroma; tumor microenvironment.
Figures
Similar articles
-
Stromally derived lysyl oxidase promotes metastasis of transforming growth factor-β-deficient mouse mammary carcinomas.Cancer Res. 2013 Sep 1;73(17):5336-46. doi: 10.1158/0008-5472.CAN-13-0012. Epub 2013 Jul 15. Cancer Res. 2013. PMID: 23856251 Free PMC article.
-
Early vascular deficits are correlated with delayed mammary tumorigenesis in the MMTV-PyMT transgenic mouse following genetic ablation of the NG2 proteoglycan.Breast Cancer Res. 2012 Apr 24;14(2):R67. doi: 10.1186/bcr3174. Breast Cancer Res. 2012. PMID: 22531600 Free PMC article.
-
Caveolin-1 gene disruption promotes mammary tumorigenesis and dramatically enhances lung metastasis in vivo. Role of Cav-1 in cell invasiveness and matrix metalloproteinase (MMP-2/9) secretion.J Biol Chem. 2004 Dec 3;279(49):51630-46. doi: 10.1074/jbc.M409214200. Epub 2004 Sep 7. J Biol Chem. 2004. PMID: 15355971
-
COX-2 modulates mammary tumor progression in response to collagen density.Breast Cancer Res. 2016 Mar 22;18(1):35. doi: 10.1186/s13058-016-0695-3. Breast Cancer Res. 2016. PMID: 27000374 Free PMC article.
-
Frequent overexpression of AMAP1, an Arf6 effector in cell invasion, is characteristic of the MMTV-PyMT rather than the MMTV-Neu human breast cancer model.Cell Commun Signal. 2018 Jan 5;16(1):1. doi: 10.1186/s12964-017-0212-z. Cell Commun Signal. 2018. PMID: 29329590 Free PMC article.
Cited by
-
Pathway Network Analyses for Autism Reveal Multisystem Involvement, Major Overlaps with Other Diseases and Convergence upon MAPK and Calcium Signaling.PLoS One. 2016 Apr 7;11(4):e0153329. doi: 10.1371/journal.pone.0153329. eCollection 2016. PLoS One. 2016. PMID: 27055244 Free PMC article.
-
Identification of radiation responsive RBC membrane associated proteins (RMAPs) in whole-body γ-irradiated New Zealand white rabbits.Biotechnol Rep (Amst). 2023 Jan 18;37:e00783. doi: 10.1016/j.btre.2023.e00783. eCollection 2023 Mar. Biotechnol Rep (Amst). 2023. PMID: 36718137 Free PMC article.
-
Prediction of blood-based biomarkers and subsequent design of bisulfite PCR-LDR-qPCR assay for breast cancer detection.BMC Cancer. 2020 Jan 31;20(1):85. doi: 10.1186/s12885-020-6574-4. BMC Cancer. 2020. PMID: 32005108 Free PMC article.
-
Adipogenesis in triple-negative breast cancer is associated with unfavorable tumor immune microenvironment and with worse survival.Sci Rep. 2021 Jun 15;11(1):12541. doi: 10.1038/s41598-021-91897-7. Sci Rep. 2021. PMID: 34131208 Free PMC article.
-
Endoxifen downregulates AKT phosphorylation through protein kinase C beta 1 inhibition in ERα+ breast cancer.NPJ Breast Cancer. 2023 Dec 19;9(1):101. doi: 10.1038/s41523-023-00606-2. NPJ Breast Cancer. 2023. PMID: 38114522 Free PMC article.
References
Grants and funding
LinkOut - more resources
Full Text Sources
Other Literature Sources
Miscellaneous