. 2014 May 5;9(5):e96171.
doi: 10.1371/journal.pone.0096171. eCollection 2014.

A novel newborn rat kernicterus model created by injecting a bilirubin solution into the cisterna magna

Affiliations

A novel newborn rat kernicterus model created by injecting a bilirubin solution into the cisterna magna

Sijie Song et al. PLoS One. .

Abstract

Background: Kernicterus still occurs around the world; however, the mechanism of bilirubin neurotoxicity remains unclear, and effective treatment strategies are lacking. To solve these problems, several kernicterus (or acute bilirubin encephalopathy) animal models have been established, but these models are difficult and expensive. Therefore, the present study was performed to establish a novel kernicterus model that is simple and affordable by injecting unconjugated bilirubin solution into the cisterna magna (CM) of ordinary newborn Sprague-Dawley (SD) rats.

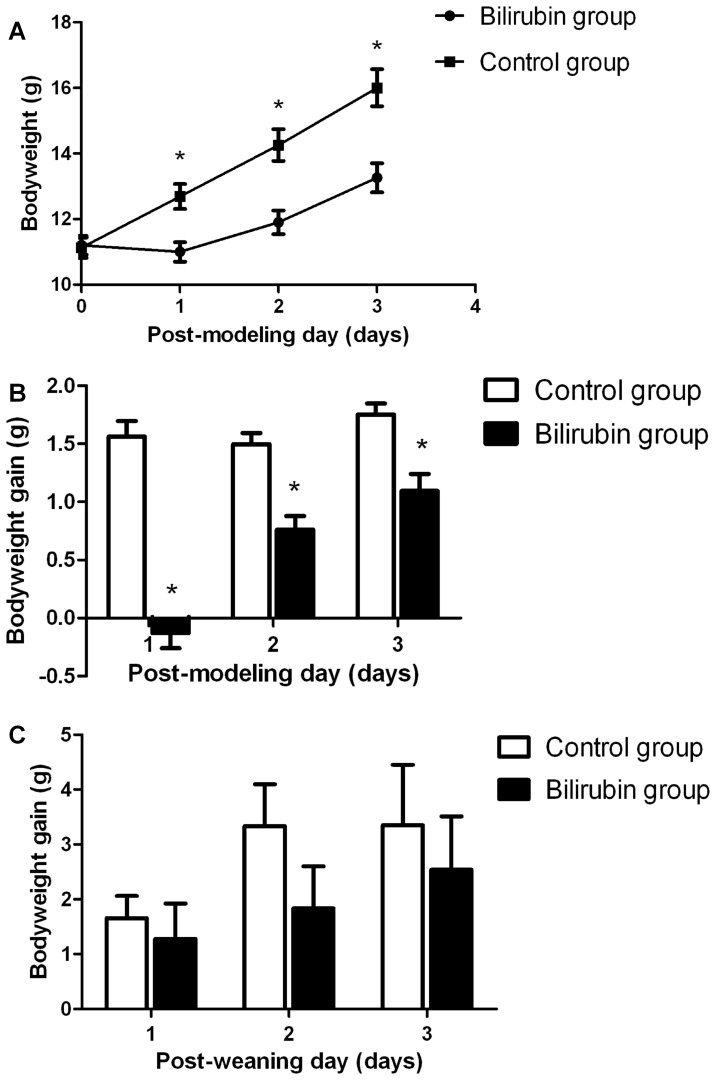
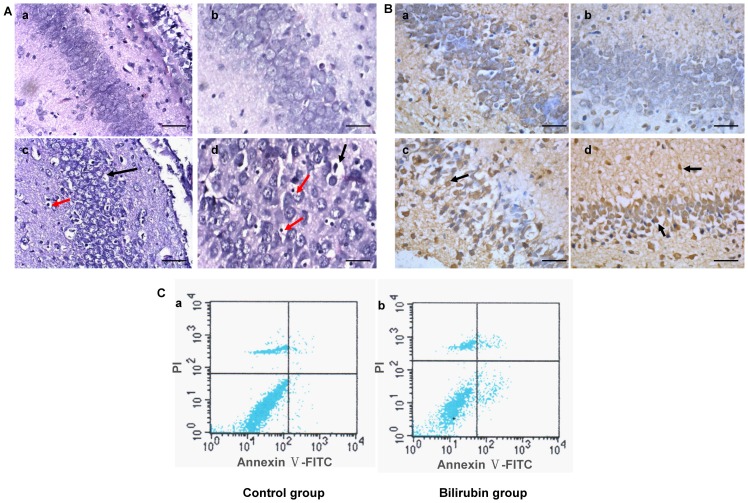
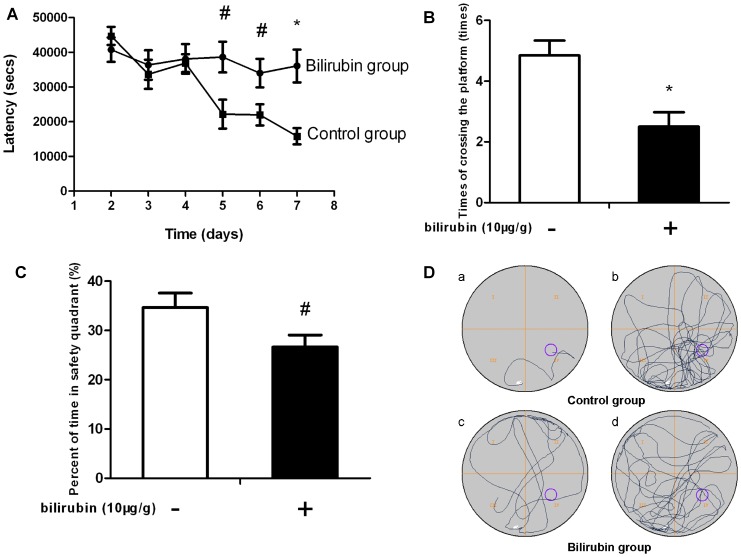
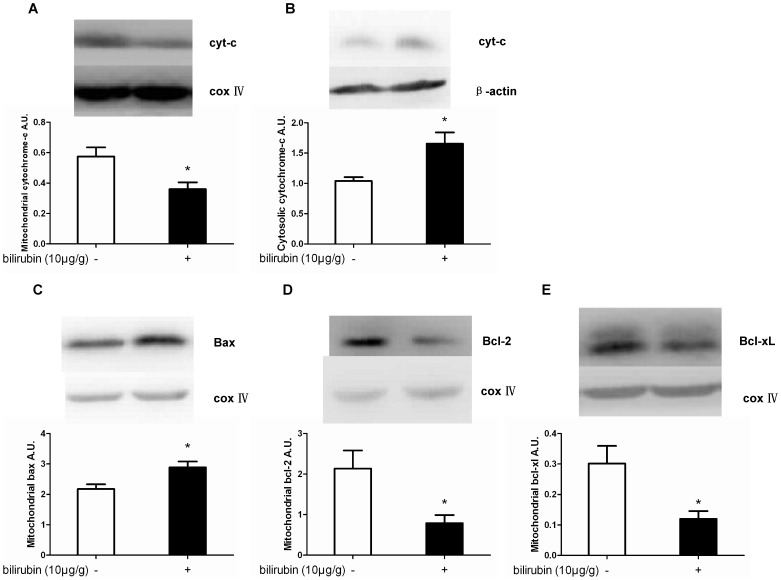
Methods: On postnatal day 5, SD rat pups were randomly divided into bilirubin and control groups. Then, either bilirubin solution or ddH2O (pH = 8.5) was injected into the CM at 10 µg/g (bodyweight). For model characterization, neurobehavioral outcomes were observed, mortality was calculated, and bodyweight was recorded after bilirubin injection and weaning. Apoptosis in the hippocampus was detected by H&E staining, TUNEL, flow cytometry and Western blotting. When the rats were 28 days old, learning and memory ability were evaluated using the Morris water maze test.

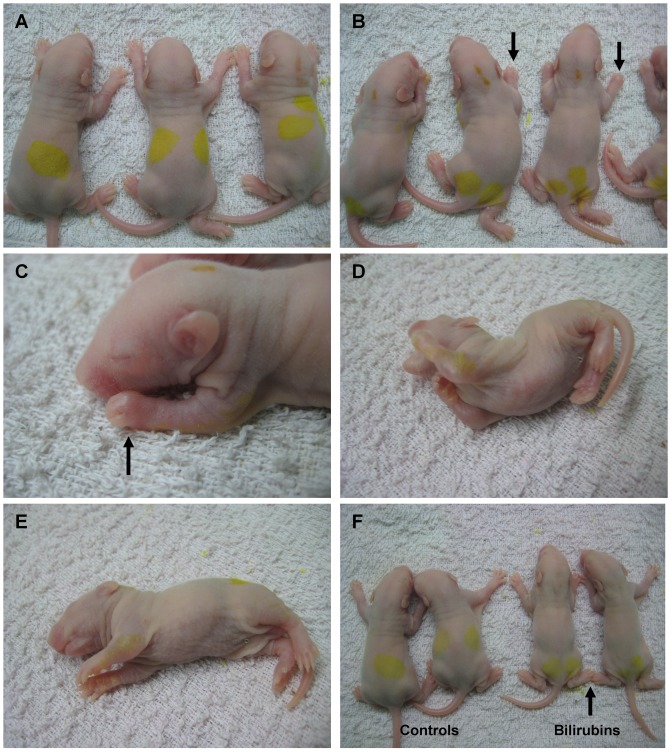
Results: The bilirubin-treated rats showed apparently abnormal neurological manifestations, such as clenched fists, opisthotonos and torsion spasms. Bodyweight gain in the bilirubin-treated rats was significantly lower than that in the controls (P<0.001). The early and late mortality of the bilirubin-treated rats were both dramatically higher than those of the controls (P = 0.004 and 0.017, respectively). Apoptosis and necrosis in the hippocampal nerve cells in the bilirubin-treated rats were observed. The bilirubin-treated rats performed worse than the controls on the Morris water maze test.

Conclusion: By injecting bilirubin into the CM, we successfully created a new kernicterus model using ordinary SD rats; the model mimics both the acute clinical manifestations and the chronic sequelae. In particular, CM injection is easy to perform; thus, more stable models for follow-up study are available.


Conflict of interest statement

Competing Interests: The authors have declared that no competing interests exist.

Figures

Figure 1
Figure 1. Clinical manifestations within 0.5–1 hour after bilirubin injection.
(A) Control group rats. No abnormal neurobehavior was detected in the controls. (B)–(E) Representative images of abnormal neurobehavior in bilirubin-treated rats. Almost all of the bilirubin-treated pups showed clenched fists (B–C) (black arrow) and opisthotonos (D); some rats showed the latericumbent position (E). (F) Comparison of prostration in the two groups. The bilirubin-treated rats show decreased muscular tone (black arrow) and prostration.
Figure 2
Figure 2. Bodyweight changes within 3 days after bilirubin injection or weaning.
(A) Bodyweights of the bilirubin-treated rats and control rats on PMDs-1/2/3. (B) Bodyweight gains of the bilirubin-treated rats and control rats on PMDs-1/2/3. (C) Bodyweight gains of the bilirubin-treated rats and control rats on PWDs-1/2/3. (n = 12 in each group). *: P<0.01 vs control group. (PMD: post-modeling day; PWD: post-weaning day).
Figure 3
Figure 3. Histology and flow cytometry (FCM) at 24 hours after bilirubin injection.
(A) H&E staining under light microscopy. Hippocampal nerve cells in the CA-3 region were morphologically normal in the control group (a, b). Cellular edema and swelling (c, d) (black arrow), and cell necrosis, including cytoplasmic condensation, endolysis, nuclear pyknosis, karyorrhexis and karyolysis (c, d) (red arrow), were observed in the bilirubin group (n = 8 in each group). (a), (c): 200×, scale bars = 200 µm; (b), (d): 400×, scale bars = 100 µm. (B) TUNEL assay under light microscopy. Few apoptotic cells in the CA-3 (a) and CA-1 (b) regions were observed in the controls. Apoptotic cells were observed in the CA-3 (c) and CA-1 (d) (black arrow) regions of the hippocampus in the bilirubin-treated rats. (n = 8 in each group). Scale bars = 100 µm. (C) Annexin V-FITC/PI (FCM) was used to determine the apoptotic (right lower quadrant) and necrotic (right upper quadrant) rates of the two groups. The apoptotic and necrotic rates of the controls were 1.33±0.36% and 1.26±0.89%, respectively (a). In the bilirubin group, the apoptotic and necrotic rates were 9.41±0.88% and 4.74±0.60%, respectively (b). There were significant differences in both the apoptotic and necrotic rates between the two groups (P<0.01). (n = 8 in each group).
Figure 4
Figure 4. Learning and memory ability based on the Morris water maze test.
(A) Escape latency to find the platform from days 2 to 7 of testing. Compared to controls, the bilirubin-treated rats showed a longer latency to escape onto the platform on days 5 to 7 (navigation trial). (B) The number of times the rats crossed over the platform location on day 8 (probe trial). The number of times that the bilirubin-treated rats crossed over the platform location was significantly lower when compared with that of the controls. (C) The percentage of time spent in the safety quadrant during the probe trial. Compared to controls, the bilirubin-treated rats spent less time in the platform safety quadrant. (D) Representative swimming paths. (a), (c): during the navigation trial on day 7. (b), (d): during the probe trial. Data are expressed as the mean ± SD (n = 12 in each group). *: P<0.01 vs control group; #: P<0.05 vs control group.
Figure 5
Figure 5. Effects of bilirubin on apoptosis-related molecules in the hippocampus at 24 hours after bilirubin injection.
At 24 h after bilirubin injection, mitochondrial cytochrome-c (A) levels were significantly decreased compared with the control group; simultaneously, the cytosolic cytochrome-c (B) levels were significantly increased compared with the controls. Additionally, a significant increase of Bax in mitochondria (C) was observed. Meanwhile, Bcl-2 and Bcl-xL (D, E) expression in the mitochondria was dramatically decreased compared with the controls. (n = 12 in each group). *: P<0.01 vs the control group.

Similar articles

Cited by

References

    1. American Academy of Pediatrics (2004) Management of hyperbilirubinemia in the newborn infant 35 or more weeks of gestation. Pediatrics 114: 297–316. - PubMed
    1. Johnson L, Bhutani VK, Karp k, Sivieri EM, Shapiro SM (2009) Clinical report from the pilot USA Kernicterus Registry (1992 to 2004)Root causes of kernicterus. J Perinatol 29 Suppl 1S25–45. - PubMed
    1. Manning D, Todd P, Maxwell M, Jane Platt M (2007) Prospective surveillance study of severe hyperbilirubinaemia in the newborn in the United Kingdom and Ireland. Arch Dis Child Fetal Neonatal Ed 92: F342–F346. - PMC - PubMed
    1. Sgro M, Campbell DM, Kandasamy S, Shah V (2012) Incidence of chronic bilirubin encephalopathy in Canada, 2007–2008. Pediatrics 130(4): e886–90. - PubMed
    1. Liu KZ, He HY, Hua ZY (2012) Clinical analysis of acute bilirubin encephalopathy in 227 neonates. J Clin Pediatr (in Chinese) 30(9): 840–844.

Publication types