

The SLE transcriptome exhibits evidence of chronic endotoxin exposure and has widespread dysregulation of non-coding and coding RNAs
- PMID: 24796678
- PMCID: PMC4010412
- DOI: 10.1371/journal.pone.0093846
The SLE transcriptome exhibits evidence of chronic endotoxin exposure and has widespread dysregulation of non-coding and coding RNAs
Abstract
Background: Gene expression studies of peripheral blood mononuclear cells from patients with systemic lupus erythematosus (SLE) have demonstrated a type I interferon signature and increased expression of inflammatory cytokine genes. Studies of patients with Aicardi Goutières syndrome, commonly cited as a single gene model for SLE, have suggested that accumulation of non-coding RNAs may drive some of the pathologic gene expression, however, no RNA sequencing studies of SLE patients have been performed. This study was designed to define altered expression of coding and non-coding RNAs and to detect globally altered RNA processing in SLE.
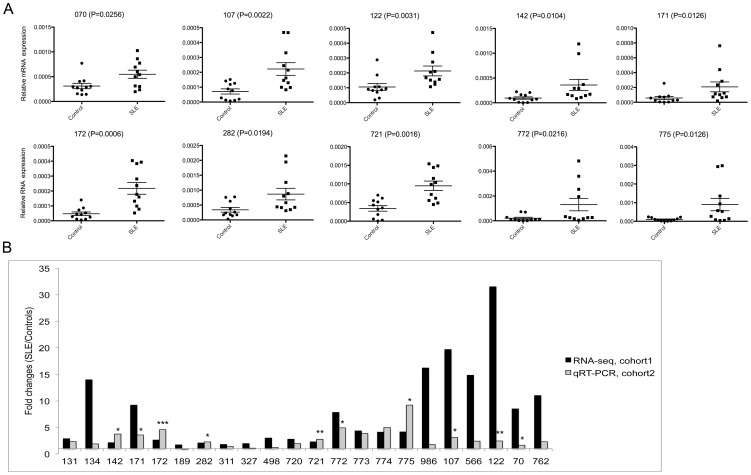
Methods: Purified monocytes from eight healthy age/gender matched controls and nine SLE patients (with low-moderate disease activity and lack of biologic drug use or immune suppressive treatment) were studied using RNA-seq. Quantitative RT-PCR was used to validate findings. Serum levels of endotoxin were measured by ELISA.
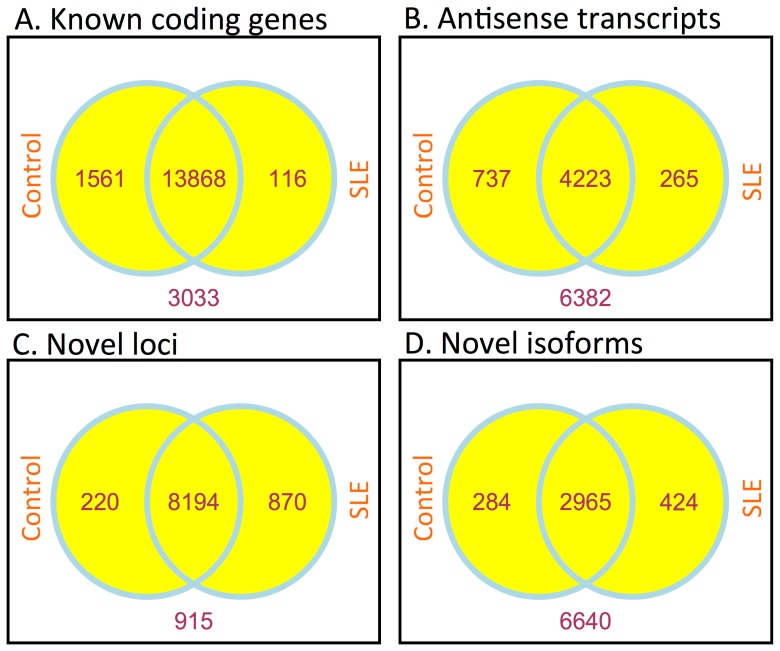
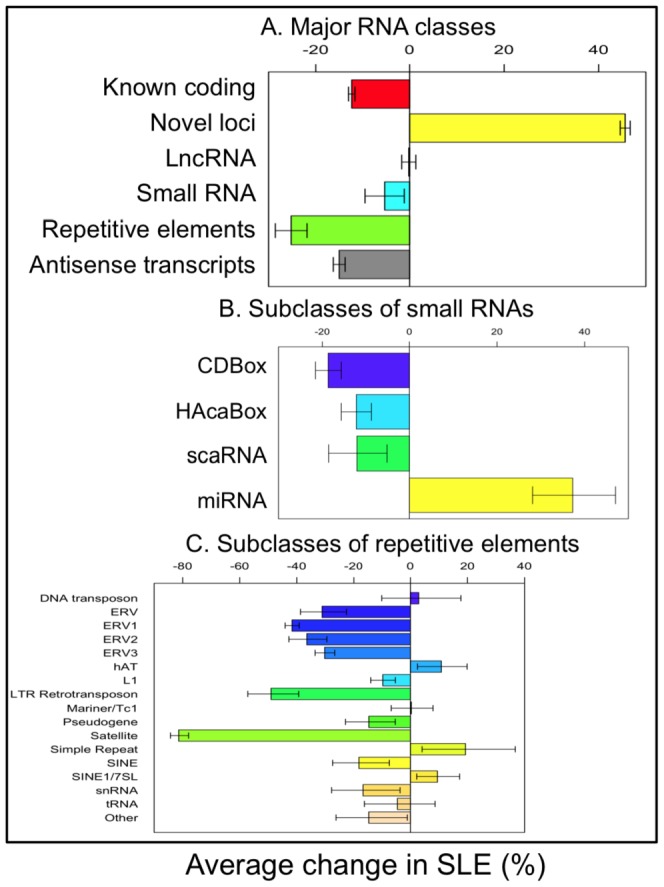
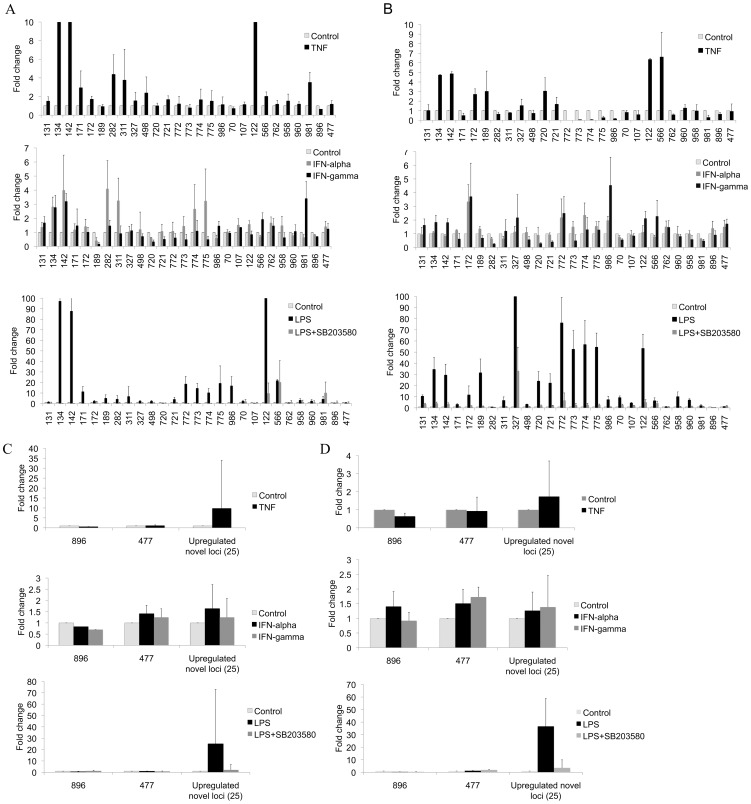
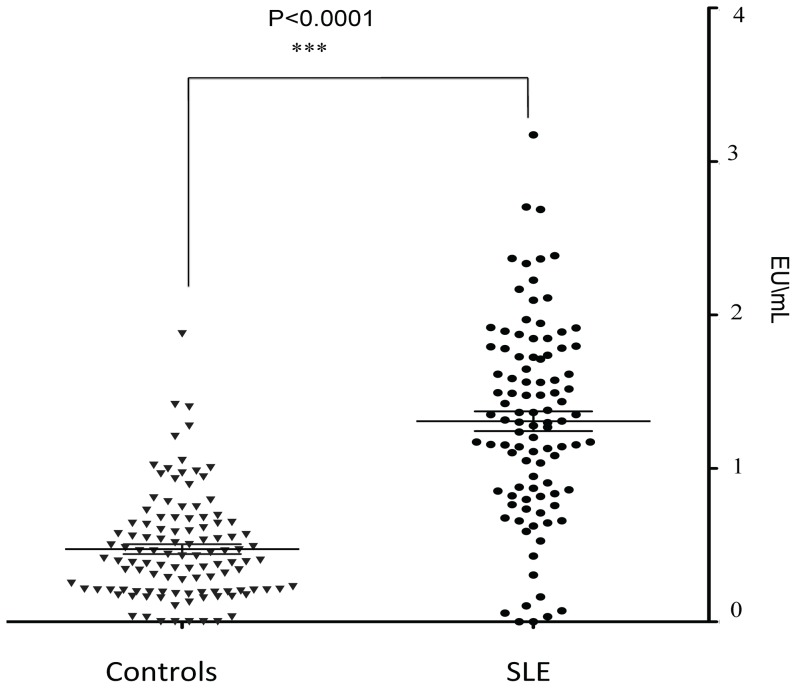
Results: We found that SLE patients had diminished expression of most endogenous retroviruses and small nucleolar RNAs, but exhibited increased expression of pri-miRNAs. Splicing patterns and polyadenylation were significantly altered. In addition, SLE monocytes expressed novel transcripts, an effect that was replicated by LPS treatment of control monocytes. We further identified increased circulating endotoxin in SLE patients.
Conclusions: Monocytes from SLE patients exhibit globally dysregulated gene expression. The transcriptome is not simply altered by the transcriptional activation of a set of genes, but is qualitatively different in SLE. The identification of novel loci, inducible by LPS, suggests that chronic microbial translocation could contribute to the immunologic dysregulation in SLE, a new potential disease mechanism.
Conflict of interest statement
Figures
Similar articles
-
RNA-Seq for enrichment and analysis of IRF5 transcript expression in SLE.PLoS One. 2013;8(1):e54487. doi: 10.1371/journal.pone.0054487. Epub 2013 Jan 18. PLoS One. 2013. PMID: 23349905 Free PMC article.
-
Integrated Transcriptome Profiling Revealed That Elevated Long Non-Coding RNA-AC007278.2 Expression Repressed CCR7 Transcription in Systemic Lupus Erythematosus.Front Immunol. 2021 Jun 16;12:615859. doi: 10.3389/fimmu.2021.615859. eCollection 2021. Front Immunol. 2021. PMID: 34220794 Free PMC article.
-
Interferon-induced protein IFIT4 is associated with systemic lupus erythematosus and promotes differentiation of monocytes into dendritic cell-like cells.Arthritis Res Ther. 2008;10(4):R91. doi: 10.1186/ar2475. Epub 2008 Aug 15. Arthritis Res Ther. 2008. PMID: 18706081 Free PMC article.
-
Systemic lupus erythematosus: From non-coding RNAs to exosomal non-coding RNAs.Pathol Res Pract. 2023 Jul;247:154508. doi: 10.1016/j.prp.2023.154508. Epub 2023 May 11. Pathol Res Pract. 2023. PMID: 37224659 Review.
-
Exploring the Role of Non-Coding RNAs in the Pathophysiology of Systemic Lupus Erythematosus.Biomolecules. 2020 Jun 22;10(6):937. doi: 10.3390/biom10060937. Biomolecules. 2020. PMID: 32580306 Free PMC article. Review.
Cited by
-
An Impaired Inflammatory and Innate Immune Response in COVID-19.Mol Cells. 2021 Jun 30;44(6):384-391. doi: 10.14348/molcells.2021.0068. Mol Cells. 2021. PMID: 34098591 Free PMC article. Review.
-
Pregnancy and lactation interfere with the response of autoimmunity to modulation of gut microbiota.Microbiome. 2019 Jul 16;7(1):105. doi: 10.1186/s40168-019-0720-8. Microbiome. 2019. PMID: 31311609 Free PMC article.
-
H3K4 tri-methylation breadth at transcription start sites impacts the transcriptome of systemic lupus erythematosus.Clin Epigenetics. 2016 Feb 2;8:14. doi: 10.1186/s13148-016-0179-4. eCollection 2016. Clin Epigenetics. 2016. PMID: 26839600 Free PMC article.
-
Bacterial infections in lupus: Roles in promoting immune activation and in pathogenesis of the disease.J Transl Autoimmun. 2020 Dec 23;4:100078. doi: 10.1016/j.jtauto.2020.100078. eCollection 2021. J Transl Autoimmun. 2020. PMID: 33490939 Free PMC article. Review.
-
Comparison of cell type and disease subset chromatin modifications in SLE.Clin Epigenetics. 2024 Nov 14;16(1):159. doi: 10.1186/s13148-024-01754-3. Clin Epigenetics. 2024. PMID: 39543716 Free PMC article.
References
-
- Kirou KA, Lee C, George S, Louca K, Papagiannis IG, et al. (2004) Coordinate overexpression of interferon-alpha-induced genes in systemic lupus erythematosus. Arthritis Rheum 50: 3958–3967. - PubMed
Publication types
MeSH terms
Substances
Grants and funding
LinkOut - more resources
Full Text Sources
Other Literature Sources
Medical
