. 2014 May 5;9(5):e96769.
doi: 10.1371/journal.pone.0096769. eCollection 2014.

Voice disorder in cystic fibrosis patients

Affiliations

Voice disorder in cystic fibrosis patients

Bruna Mendes Lourenço et al. PLoS One. .

Abstract

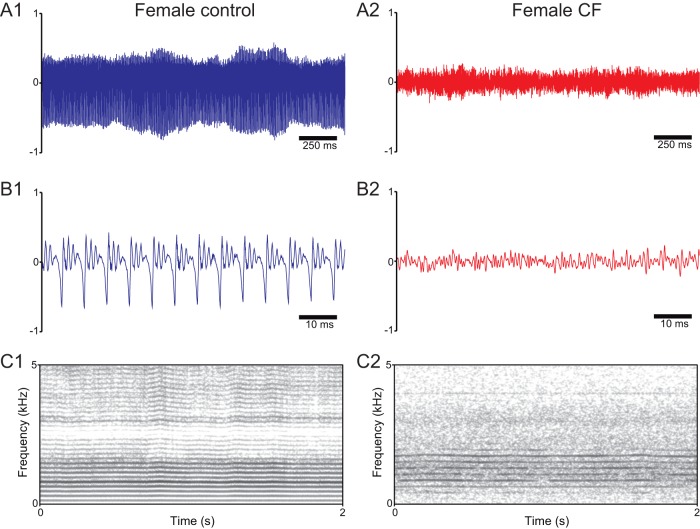
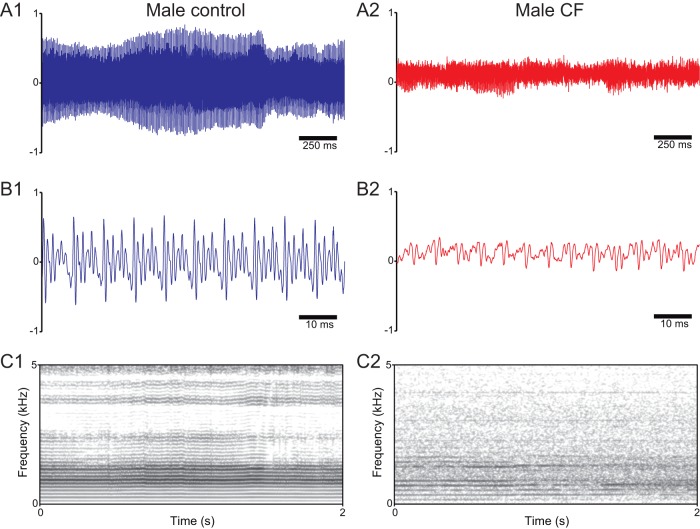
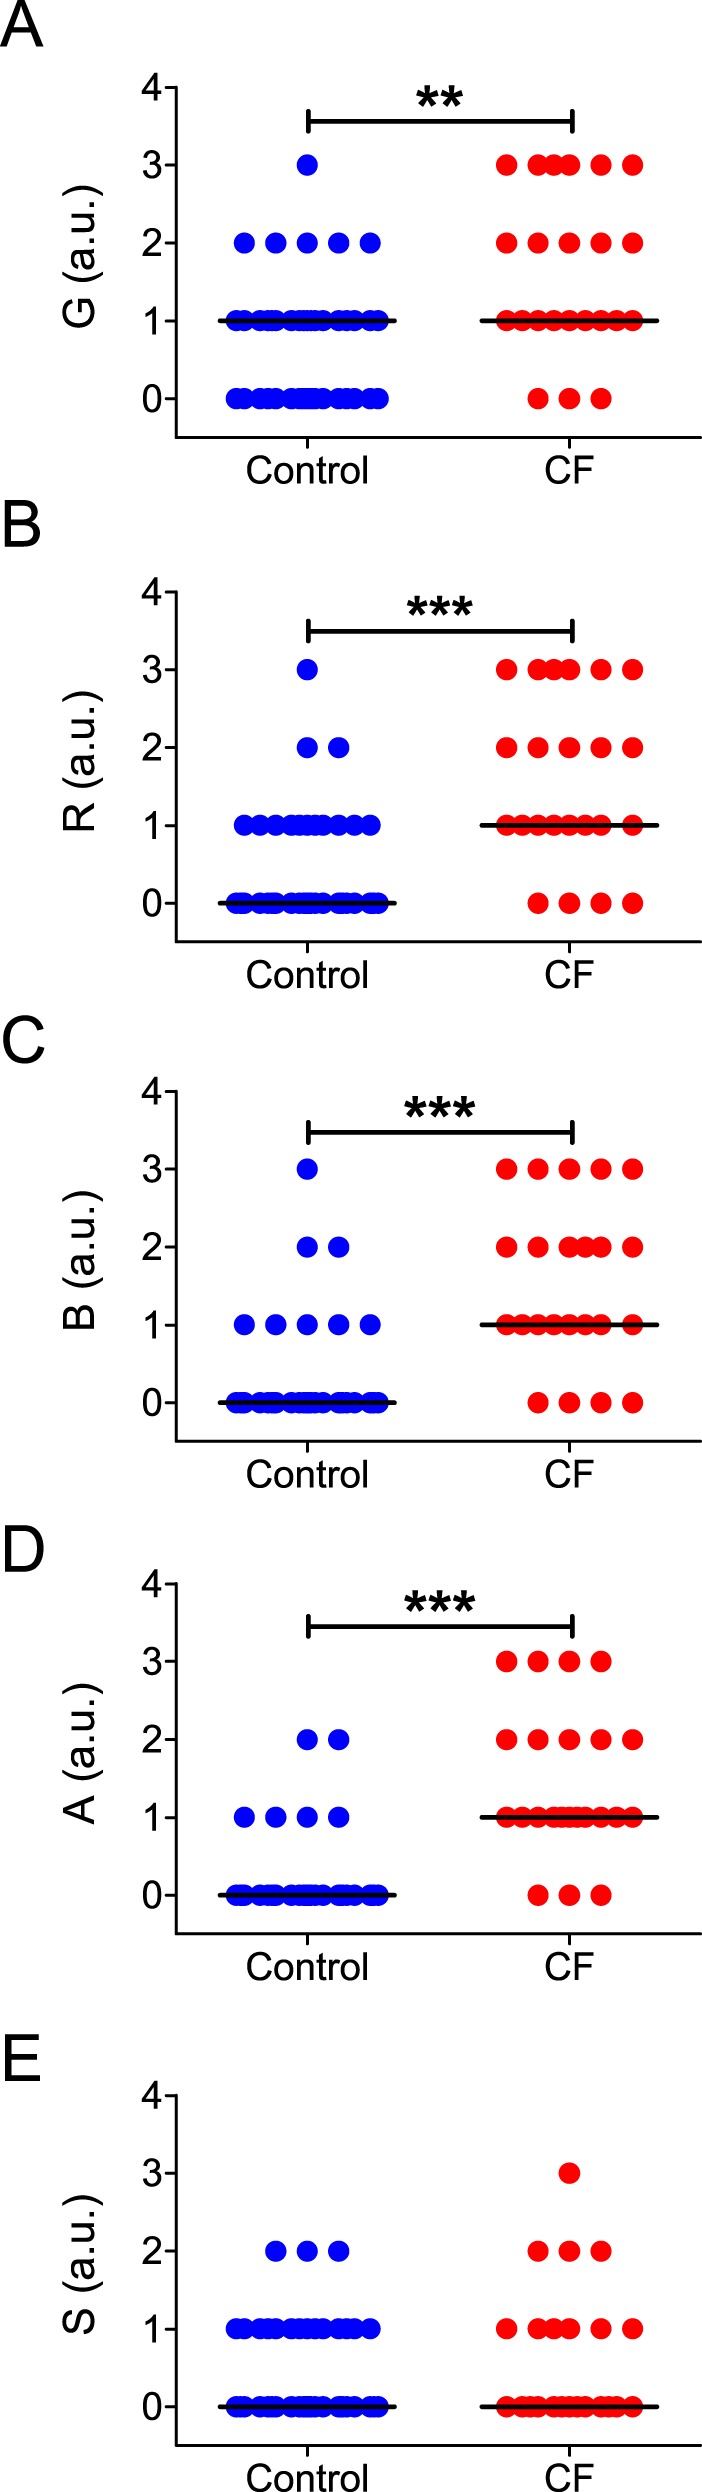
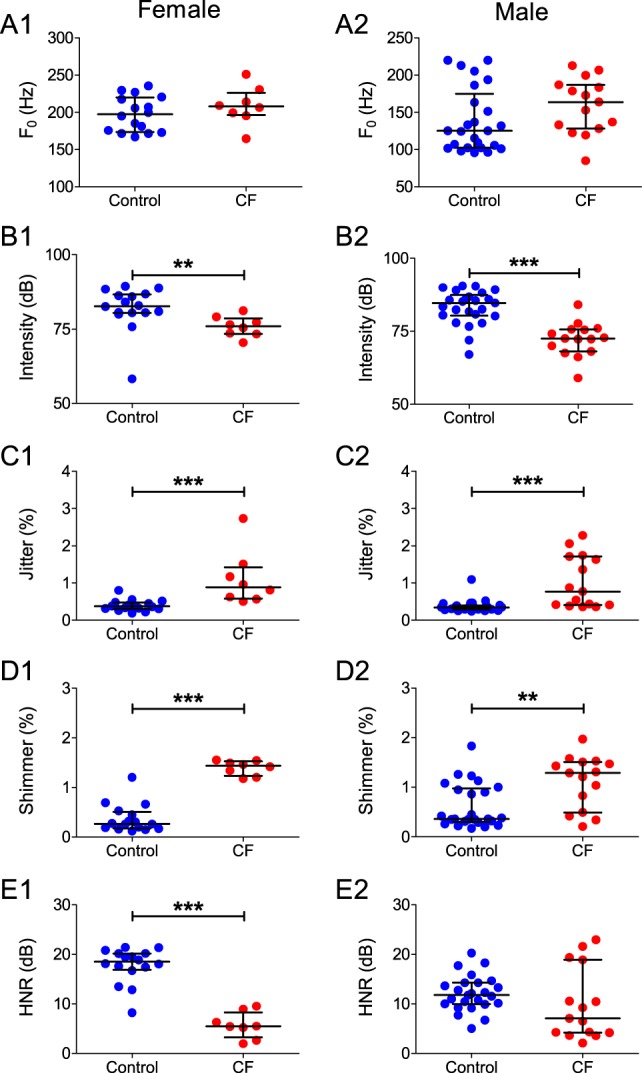
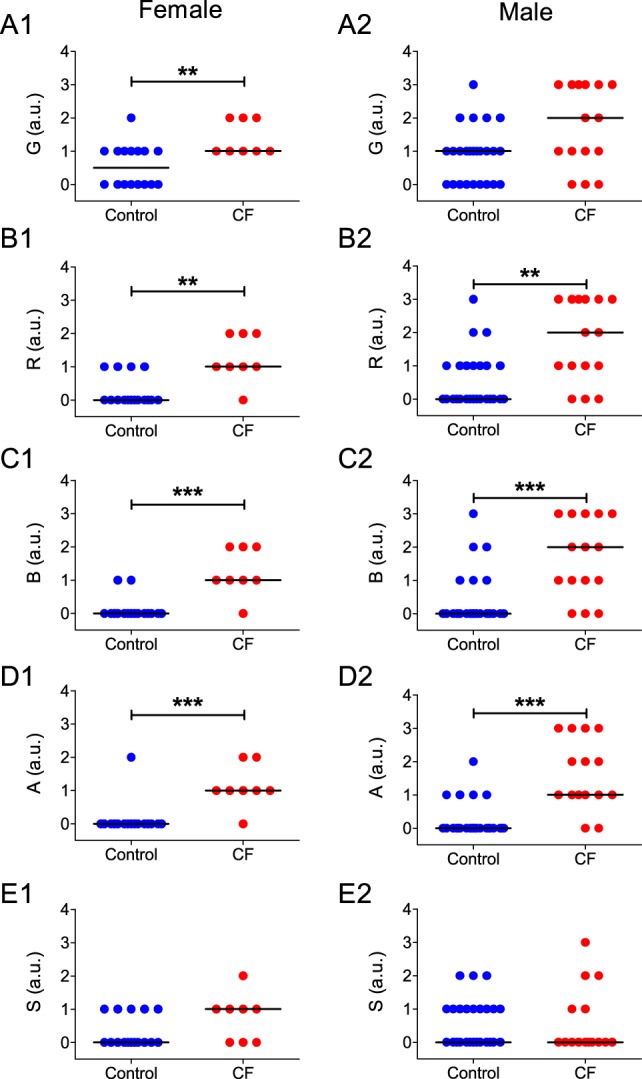
Cystic fibrosis is a common autosomal recessive disorder with drastic respiratory symptoms, including shortness of breath and chronic cough. While most of cystic fibrosis treatment is dedicated to mitigating the effects of respiratory dysfunction, the potential effects of this disease on vocal parameters have not been systematically studied. We hypothesized that cystic fibrosis patients, given their characteristic respiratory disorders, would also present dysphonic symptoms. Given that voice disorders can severely impair quality of life, the identification of a potential cystic fibrosis-related dysphonia could be of great value for the clinical evaluation and treatment of this disease. We tested our hypothesis by measuring vocal parameters, using both objective physical measures and the GRBAS subjective evaluation method, in male and female cystic fibrosis patients undergoing conventional treatment and compared them to age and sex matched controls. We found that cystic fibrosis patients had a significantly lower vocal intensity and harmonic to noise ratio, as well as increased levels of jitter and shimmer. In addition, cystic fibrosis patients also showed higher scores of roughness, breathiness and asthenia, as well as a significantly altered general grade of dysphonia. When we segregated the results according to sex, we observed that, as a group, only female cystic fibrosis patients had significantly lower values of harmonic to noise ratio and an abnormal general grade of dysphonia in relation to matched controls, suggesting that cystic fibrosis exerts a more pronounced effect on vocal parameters of women in relation to men. Overall, the dysphonic characteristics of CF patients can be explained by dysfunctions in vocal fold movement and partial upper airway obstruction, potentially caused by the accumulation of mucus and chronic cough characteristic of CF symptomatology. Our results show that CF patients exhibit significant dysphonia and suggest they may potentially benefit from voice therapy as a parallel treatment strategy.


Conflict of interest statement

Competing Interests: The authors have declared that no competing interests exist.

Figures

Figure 1
Figure 1. Representative voice recordings and spectrograms of female patients with CF (red) and healthy controls (blue).
A: Sound recordings of/a/vowel phonations from a female control subject (A1) and a female patient with CF (A2); note the markedly reduced amplitude range of the signal from the CF patient in relation to the control. B: Amplified views of the recordings presented in A1 and A2; note the irregularity of the voice signal from the CF patient in relation to the control. C: Spectrogram (frequency domain) representations of the recordings presented in A1 and A2; note the higher level of background noise and low formant segregation in the CF patient in relation to the healthy control.
Figure 2
Figure 2. Representative voice recordings and spectrograms of male patients with CF (red) and healthy controls (blue).
A: Sound recordings of/a/vowel phonations from a male control subject (A1) and a male patient with CF (A2); note the markedly reduced amplitude range of the signal from the CF patient in relation to the control. B: Amplified views of the recordings presented in A1 and A2; note the irregularity of the voice signal from the CF patient in relation to the control. C: Spectrogram (frequency domain) representations of the recordings presented in A1 and A2; note the higher level of background noise and low formant segregation in the CF patient in relation to the healthy control.
Figure 3
Figure 3. Objective measurements of vocal parameters of control subjects and CF patients.
Horizontal lines and error bars represent median±IQR for all variables. Subjects were pooled independently of their sex. A: Values of F0 for each group. B: Values of intensity for each group; note the significant reduction in intensity in the CF group. C: Values of jitter for each group; note the significant increase in jitter in the CF group. D: Values of shimmer for each group; note the significant increase in shimmer in the CF group. E: Values of HNR for each group; note the significant reduction in this variable in the CF group. ***  = P<0.0001.
Figure 4
Figure 4. Subjective measurements of vocal parameters of male and female control subjects and CF patients.
Horizontal lines and error bars represent the median value of each group. Subjects were pooled independently of their sex. A: Values of G for each group; note the significant increase in G in the CF group. B: Values of R for each group; note the significant increase in R in the CF group. C: Values of B for each group; note the significant increase in B in the CF group. D: Values of A for each group; note the significant increase in A in the CF group. E: Values of S for each group. **  = P<0.001; ***  = P<0.0001.
Figure 5
Figure 5. Objective measurements of vocal parameters of male and female control subjects and CF patients.
Horizontal lines and error bars represent median±IQR for all variables. A: Values of F0 for female (A1) and male (A2) subject groups. B: Values of intensity for female (A1) and male (A2) subject groups. C: Values of jitter for female (A1) and male (A2) subject groups. D: Values of shimmer for female (A1) and male (A2) subject groups. E: Values of HNR for female (A1) and male (A2) subject groups; note that only female CF patients have a lower HNR in relation to the matched controls. **  = P<0.001; ***  = P<0.0001.
Figure 6
Figure 6. Subjective measurements of vocal parameters of male and female control subjects and CF patients.
Horizontal lines and error bars represent the median value of each group. A: Values of G for female (A1) and male (A2) subject groups; note that only female patients have a significant change in G in relation to the matched controls. B: Values of R for female (A1) and male (A2) subject groups. C: Values of B for female (A1) and male (A2) subject groups. D: Values of A for female (A1) and male (A2) subject groups. E: Values of S for female (A1) and male (A2) subject groups. **  = P<0.001; ***  = P<0.0001.

Similar articles

Cited by

References

    1. Cohen SM, Elackattu A, Noordzij JP, Walsh MJ, Langmore SE (2009) Palliative Treatment of Dysphonia and Dysarthria. Otolaryngol Clin North Am 42: 107–121 10.1016/j.otc.2008.09.010 - DOI - PubMed
    1. Gibson PG, Vertigan AE (2009) Speech pathology for chronic cough: a new approach. Pulm Pharmacol Ther 22: 159–162 10.1016/j.pupt.2008.11.005 - DOI - PubMed
    1. Murry T, Medrado R, Hogikyan ND, Aviv JE (2004) The relationship between ratings of voice quality and quality of life measures. J Voice 18: 183–192 10.1016/j.jvoice.2003.11.003 - DOI - PubMed
    1. Wilson JA, Deary IJ, Millar A, Mackenzie K (2002) The quality of life impact of dysphonia. Clin Otolaryngol Allied Sci 27: 179–182. - PubMed
    1. Deary IJ, Scott S, Wilson IM, White A, MacKenzie K, et al. (1997) Personality and psychological distress in dysphonia. Br J Health Psychol 2: 333–341 10.1111/j.2044-8287.1997.tb00547.x - DOI

Publication types