. 2014 May 5;9(5):e96786.
doi: 10.1371/journal.pone.0096786. eCollection 2014.

Glucose controls morphodynamics of LPS-stimulated macrophages

Affiliations

Glucose controls morphodynamics of LPS-stimulated macrophages

Gerda Venter et al. PLoS One. .

Abstract

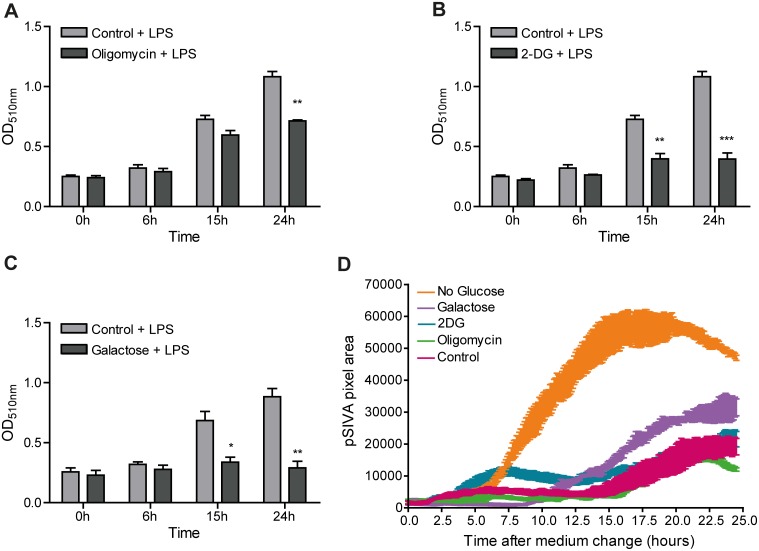
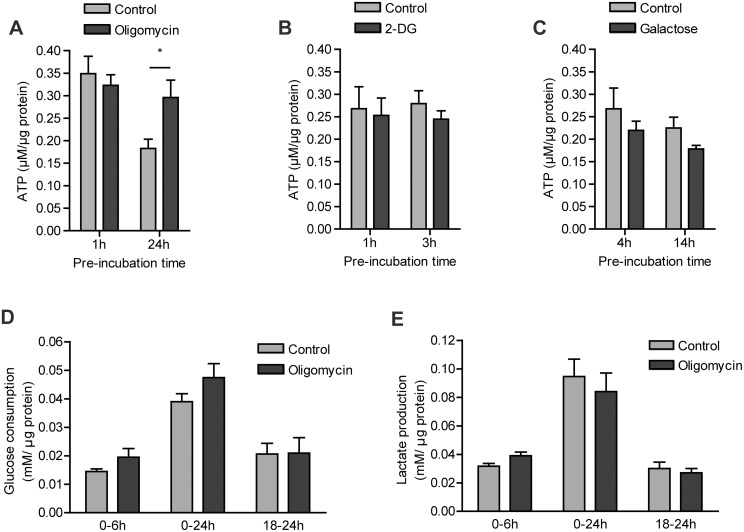
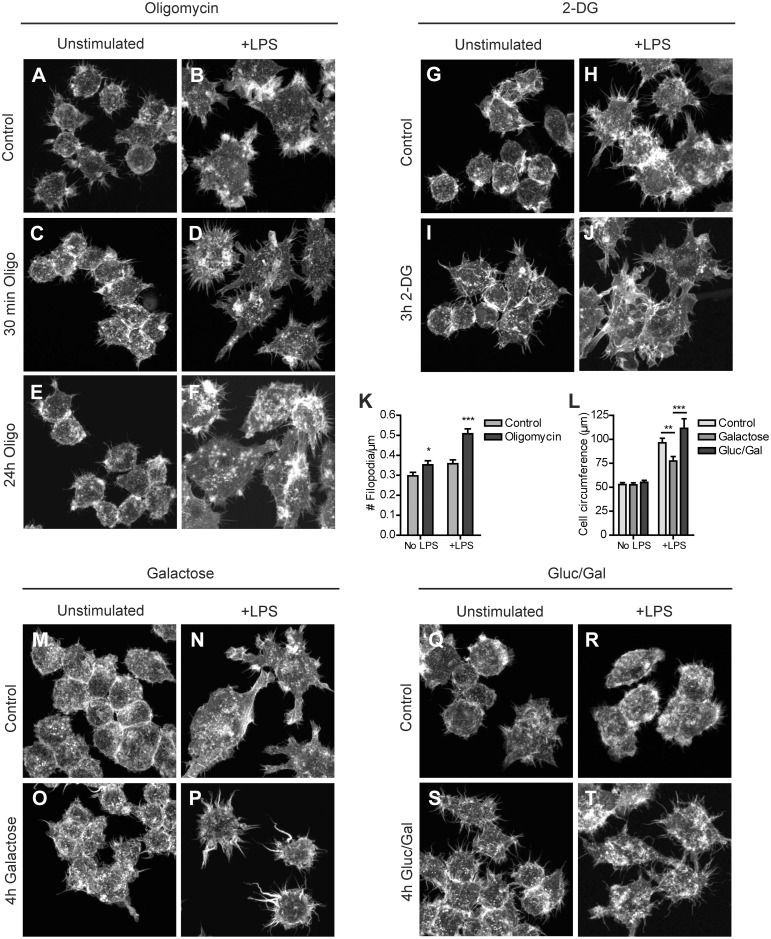
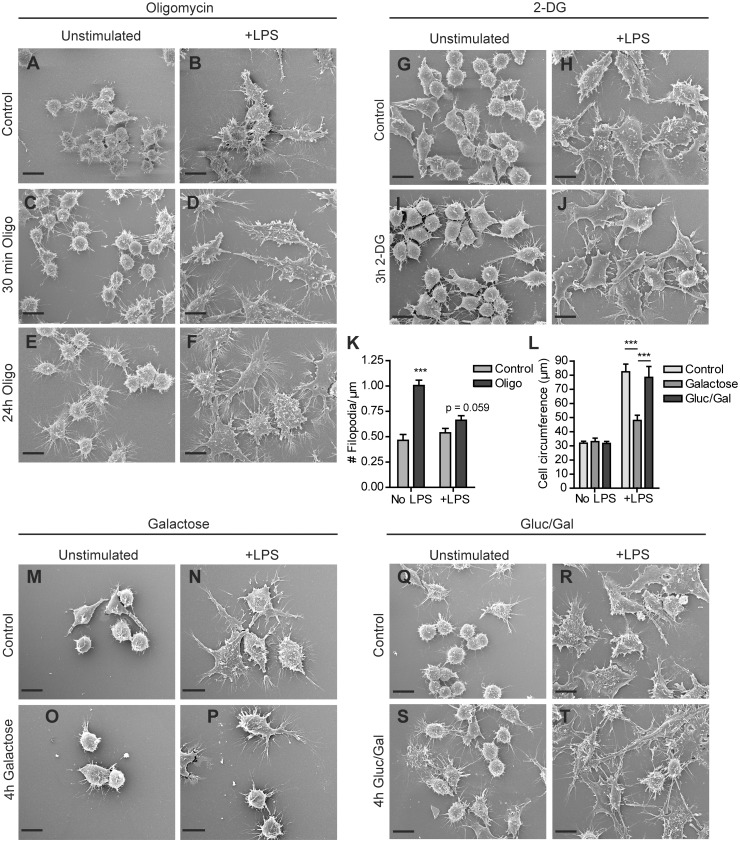
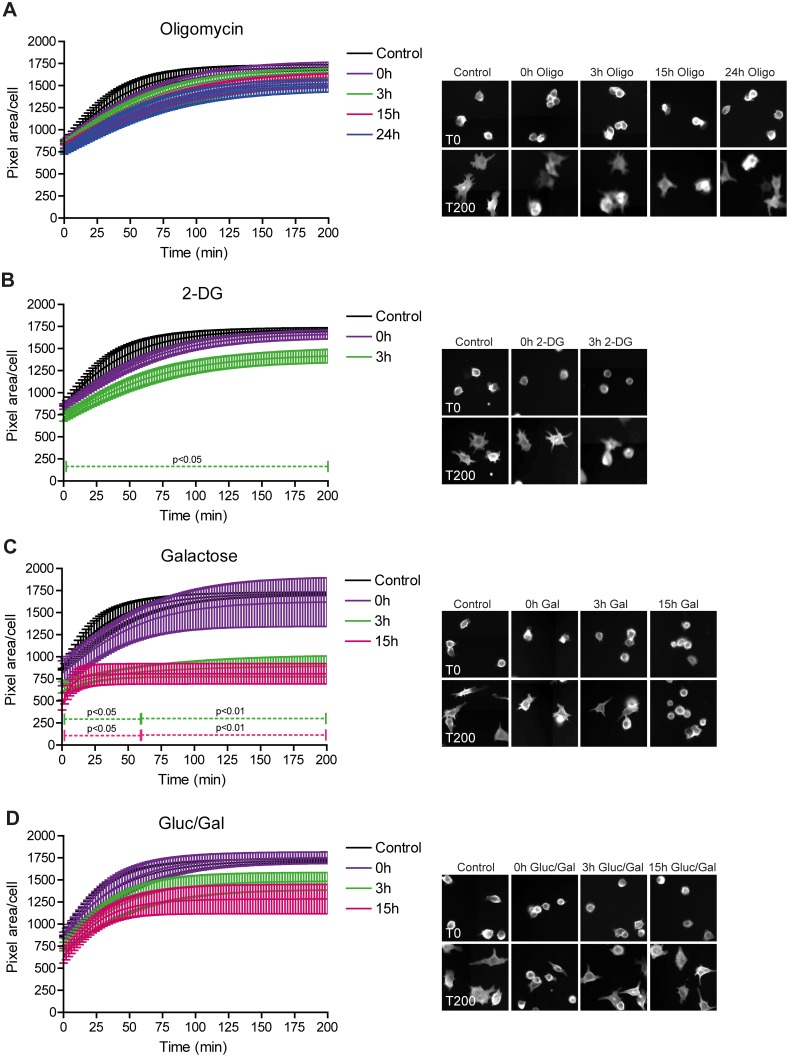
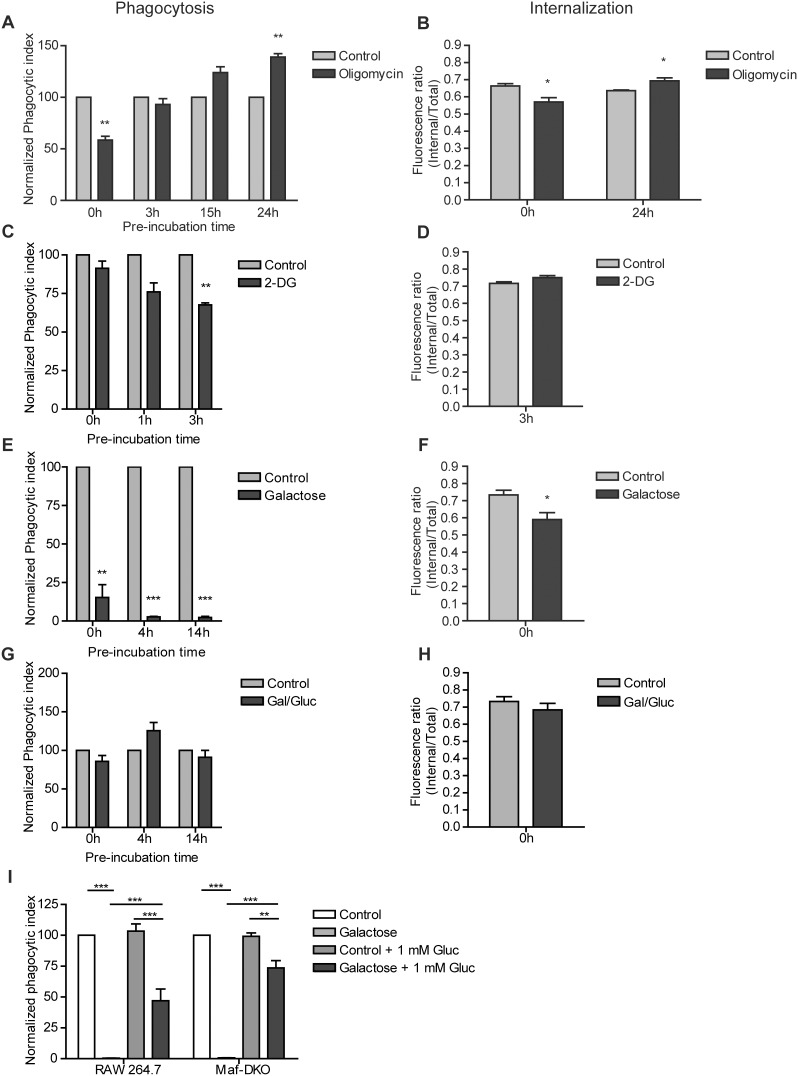
Macrophages constantly undergo morphological changes when quiescently surveying the tissue milieu for signs of microbial infection or damage, or after activation when they are phagocytosing cellular debris or foreign material. These morphofunctional alterations require active actin cytoskeleton remodeling and metabolic adaptation. Here we analyzed RAW 264.7 and Maf-DKO macrophages as models to study whether there is a specific association between aspects of carbohydrate metabolism and actin-based processes in LPS-stimulated macrophages. We demonstrate that the capacity to undergo LPS-induced cell shape changes and to phagocytose complement-opsonized zymosan (COZ) particles does not depend on oxidative phosphorylation activity but is fueled by glycolysis. Different macrophage activities like spreading, formation of cell protrusions, as well as phagocytosis of COZ, were thereby strongly reliant on the presence of low levels of extracellular glucose. Since global ATP production was not affected by rewiring of glucose catabolism and inhibition of glycolysis by 2-deoxy-D-glucose and glucose deprivation had differential effects, our observations suggest a non-metabolic role for glucose in actin cytoskeletal remodeling in macrophages, e.g. via posttranslational modification of receptors or signaling molecules, or other effects on the machinery that drives actin cytoskeletal changes. Our findings impute a decisive role for the nutrient state of the tissue microenvironment in macrophage morphodynamics.


Conflict of interest statement

Competing Interests: The authors have declared that no competing interests exist.

Figures

Figure 1
Figure 1. Proliferation and viability of RAW 264.7 cells under different metabolic conditions.
Proliferation was monitored for 24 hours in the presence of LPS and expressed as the increase in total cellular protein in either control medium (25 mM glucose) or medium containing 2.5 µM oligomycin and 25 mM glucose (A), 10 mM 2-DG and 25 mM glucose (B), or 10 mM galactose and no glucose (C). Cell viability was also assessed for 24 hours under the same medium conditions in the presence of pSIVA apoptosis biosensor (D). The appearance of the fluorescent pSIVA signal was recorded in real time and the total pixel area per frame was measured using Fiji Imaging software. An increase in the pSIVA pixel area correlates linearly with increase in the amount of apoptotic cells. Data in A–C represent means ± SEM of three independent experiments performed in triplicate and in D the averages of one experiment performed in triplicate. (*p<0.05, **p<0.01, ***p<0.001, unpaired t-test).
Figure 2
Figure 2. ATP levels under different metabolic conditions and the effect of OXPHOS inhibition on glycolytic flux.
RAW 264.7 cells were incubated for the indicated time intervals with control (25 mM glucose) medium, or medium containing 2.5 µM oligomycin and 25 mM glucose (A,D,E), 10 mM 2-DG and 25 mM glucose (B), or 10 mM galactose and no glucose (C). Intracellular ATP concentrations and total cellular protein were measured in PCA cell extracts (A,B,C). Glucose consumption (D) and lactate production (E) were measured in medium supernatants during the first 6 hours (0–6 h), the last 6 hours (18–24 h), as well as the whole 24 hours (0–24 h) of treatment. Data represent means ± SEM of three experiments performed in triplicate. (*p<0.05, unpaired t-test).
Figure 3
Figure 3. Actin cytoskeletal structural changes induced by inhibition of glycolysis or mitochondrial OXPHOS.
RAW 264.7 cells were seeded on glass coverslips, incubated in control medium or medium containing 2.5 µM oligomycin and 25 mM glucose (A–F), 10 mM 2-DG and 25 mM glucose (G–J), 10 mM galactose and no glucose (M–P), or 1 mM glucose and 10 mM galactose (Q–T) for the indicated time periods and stimulated overnight with LPS or left unstimulated. After fixation in 2% PFA, cellular actin was stained with phalloidin-Alexa568 and cells were imaged on a Zeiss LSM510 meta confocal laser scanning microscope. The number of filopodia extending radially from the cell surface (expressed as # filopodia per µM contour length; see M&M) was determined for control cells and cells treated for 24 hours with oligomycin, in the presence and absence of LPS (K). The average cell circumference was determined for cells in control medium or medium containing 10 mM galactose, or 1 mM glucose and 10 mM galactose (L). (*p<0.05, **p<0.01, ***p<0.001, unpaired t-test).
Figure 4
Figure 4. Effect of glucose deprivation and glycolysis or OXPHOS inhibition on morphology of RAW 264.7 cells.
Cells were seeded on glass coverslips, incubated in control medium or medium containing 2.5 µM oligomycin and 25 mM glucose (A–F), 10 mM 2-DG and 25 mM glucose (G–J), 10 mM galactose and no glucose (M–P), or 1 mM glucose and 10 mM galactosel (Q–T) for the indicated time periods and stimulated overnight with LPS or left unstimulated. Coverslips were fixed and subjected to scanning electron microscopy. The number of filopodia extending radially from the cell surface was determined for control cells and cells treated for 24 hours with oligomycin, in the presence and absence of LPS (K). The average cell circumference was determined for cells in control medium or medium containing 10 mM galactose, or 1 mM glucose and 10 mM galactose (L). (***p<0.001, unpaired t-test). (Bar = 10 µm).
Figure 5
Figure 5. LPS-stimulated spreading of RAW 264.7 macrophages is compromised by glucose deprivation.
RAW 264.7 macrophages expressing Lifeact-EYFP were pre-incubated in control medium or medium containing 2.5 µM oligomycin and 25 mM glucose (A), 10 mM 2-DG and 25 mM glucose (B), 10 mM galactose and no glucose (C), or 1 mM glucose and 10 mM galactosel (D) medium for the indicated time periods. To assess spreading efficiency, cells were detached with EDTA, re-suspended, seeded in 96 well plates and allowed to adhere. Cell spreading of EYFP-positive cells was recorded over time using a BD Pathway high content microscope. The average pixel area per cell was determined at 10 minute intervals. Lines and bars represent means ± SEM of three independent experiments performed in triplicate. For every condition, representative images of cells at 0 and 200 minutes are presented in the panel on the right.
Figure 6
Figure 6. Macrophages require glucose for phagocytosis of COZ.
RAW 264.7 cells were incubated for the indicated times with control medium, or medium containing 2.5 µM oligomycin and 25 mM glucose (A&B), 10 mM 2-DG and 25 mM glucose (C&D), 10 mM galactose and no glucose (E&F), or 10 mM galactose and 1 mM glucose (G&H) and stimulated o/n with 100 ng/ml LPS. The phagocytic index (A,C,E&G) was determined by incubating cells in the respective media with FITC-labeled complement opsonized zymosan (COZ) particles for 30 min, analyzed by FACS and calculated as described in materials and methods. The internalization efficiency (B,D,F&H) was determined by quenching extracellular FITC-COZ of one sample fraction with 0.05% trypan blue in potassium dihydrogen citrate/saline, pH 4.4. Unquenched fractions were used to determine the total fluorescence per cell (internalized and external particles), while quenched fractions were used to measure only the internal fluorescence per cell. The effect of reintroducing glucose (+1 mM Gluc) in the medium after 30 minutes of phagocytosis in glucose-free medium was assessed in both RAW 264.7 and Maf-DKO cells (I). Values in A,C,E,G&I represent normalized means ± SEM of three or four independent experiments performed in triplicate (*p<0.05, **p<0.01, ***p<0.001; one-sample t-test (A–H) or two-way ANOVA and Bonferroni posttest (I)). Values in B,D,F&H represent means ± SEM of three experiments performed in triplicate. (*p<0.05; unpaired t-test).

Similar articles

Cited by

References

    1. Murray PJ, Wynn TA (2011) Protective and pathogenic functions of macrophage subsets. Nat Rev Immunol 11: 14. - PMC - PubMed
    1. Mosser DM, Edwards JP (2008) Exploring the full spectrum of macrophage activation. Nat Rev Immunol 8: 958. - PMC - PubMed
    1. Mills CD, Kincaid K, Alt JM, Heilman MJ, Hill AM (2000) M-1/M-2 Macrophages and the Th1/Th2 Paradigm. J Immunol 164: 6166–6173. - PubMed
    1. Mantovani A, Sica A, Locati M (2005) Macrophage Polarization Comes of Age. Immunity 23: 344–346. - PubMed
    1. Rodríguez-Prados J-C, Través PG, Cuenca J, Rico D, Aragonés J, et al. (2010) Substrate Fate in Activated Macrophages: A Comparison between Innate, Classic, and Alternative Activation. J Immunol 185: 605–614. - PubMed

Publication types

MeSH terms

LinkOut - more resources