

Evaluation of influence of single nucleotide polymorphisms in cytochrome P450 2B6 on substrate recognition using computational docking and molecular dynamics simulation
- PMID: 24796891
- PMCID: PMC4010486
- DOI: 10.1371/journal.pone.0096789
Evaluation of influence of single nucleotide polymorphisms in cytochrome P450 2B6 on substrate recognition using computational docking and molecular dynamics simulation
Abstract
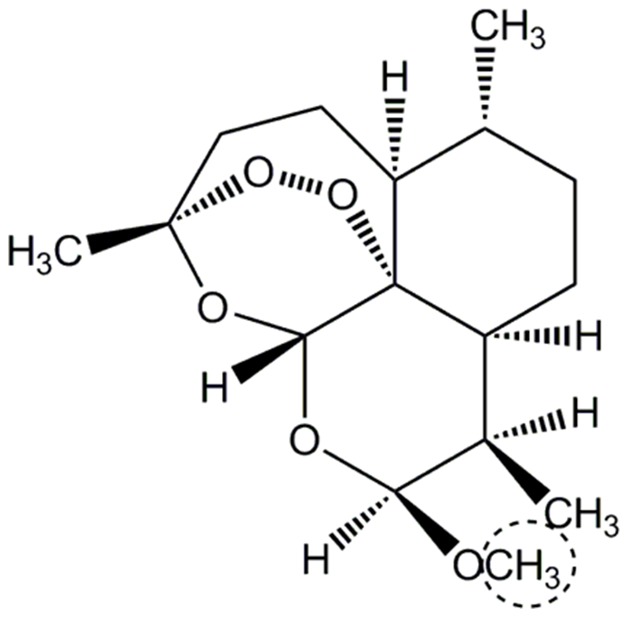
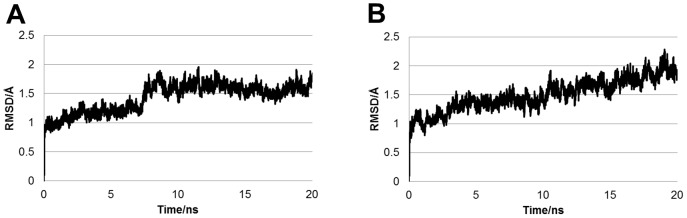
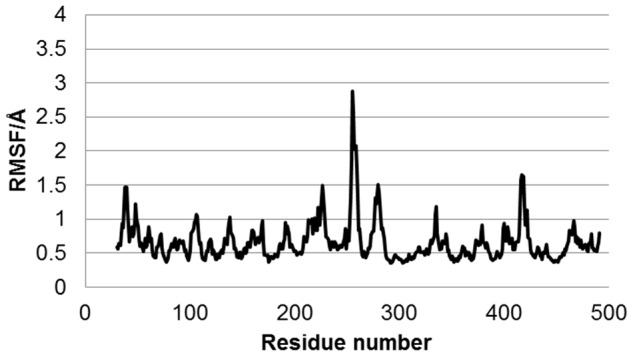
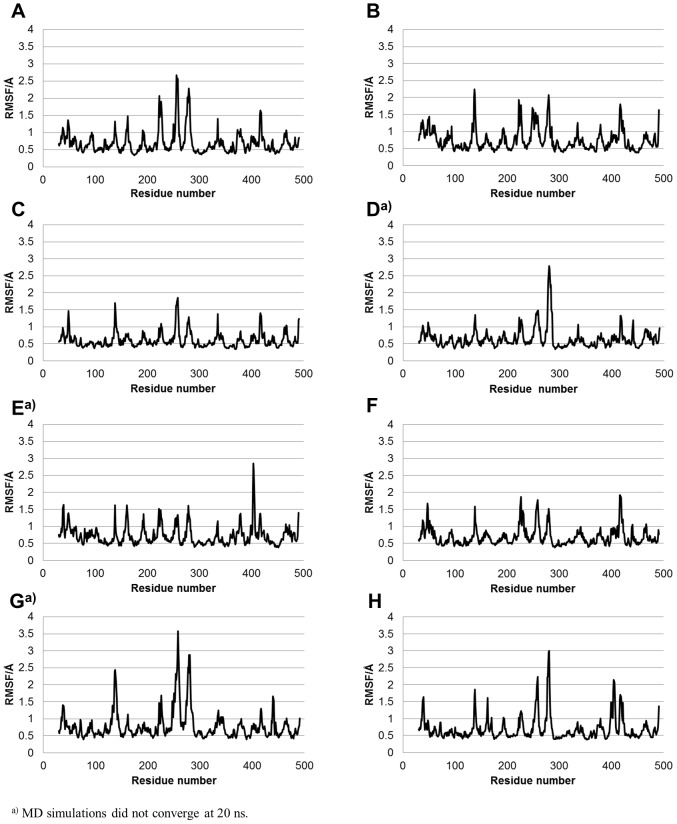
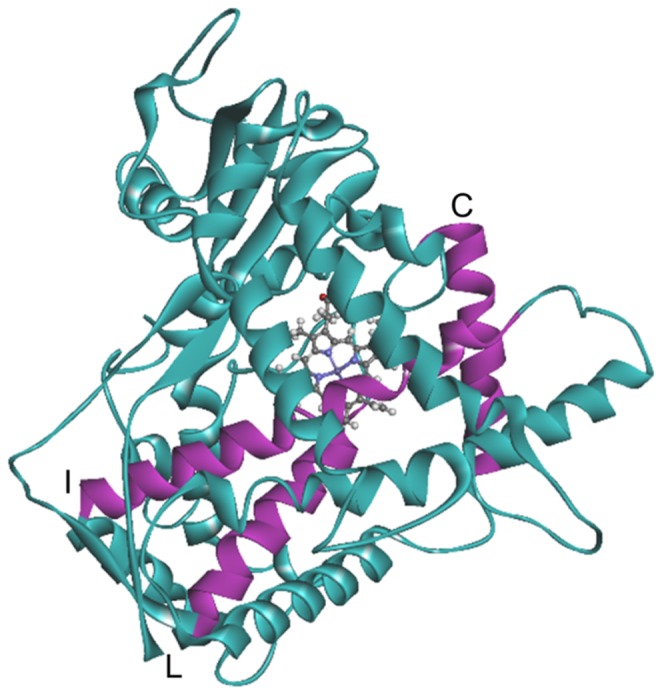
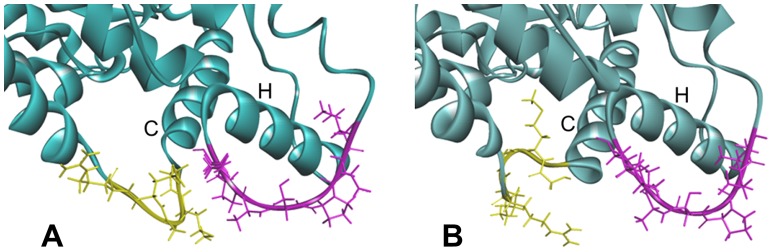
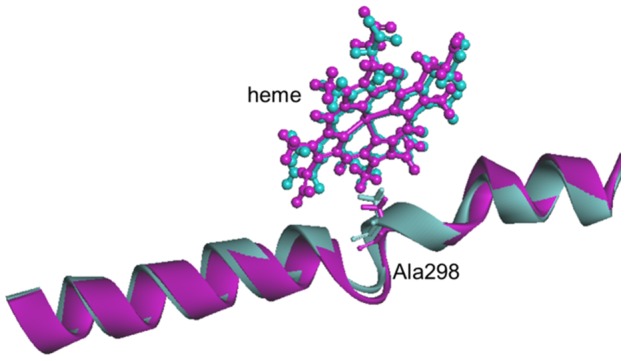
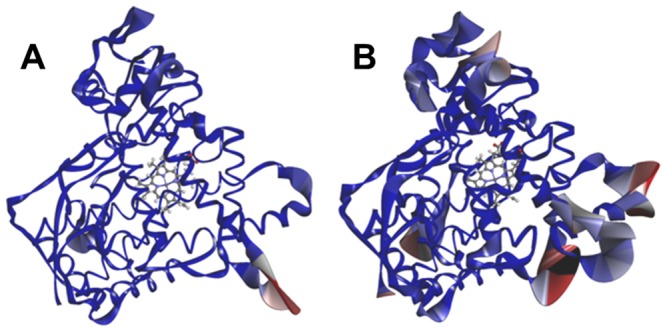
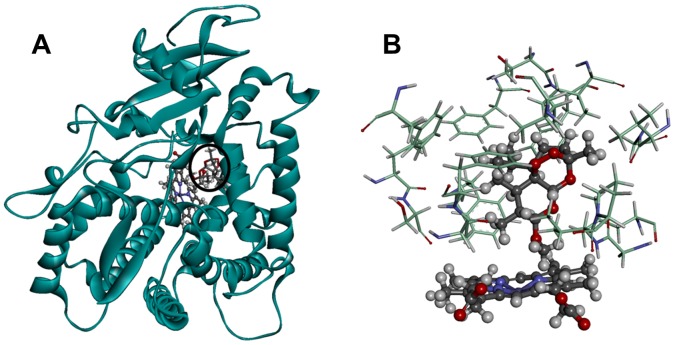
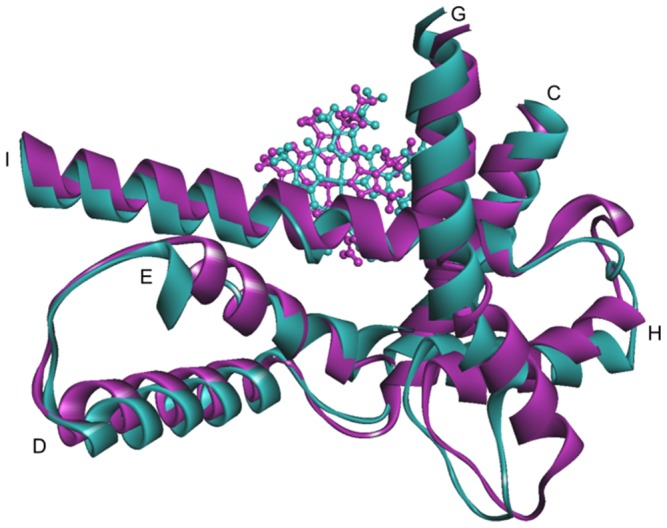
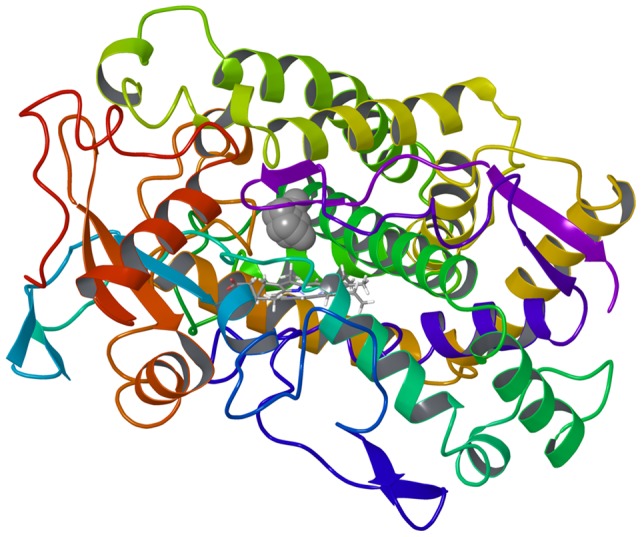
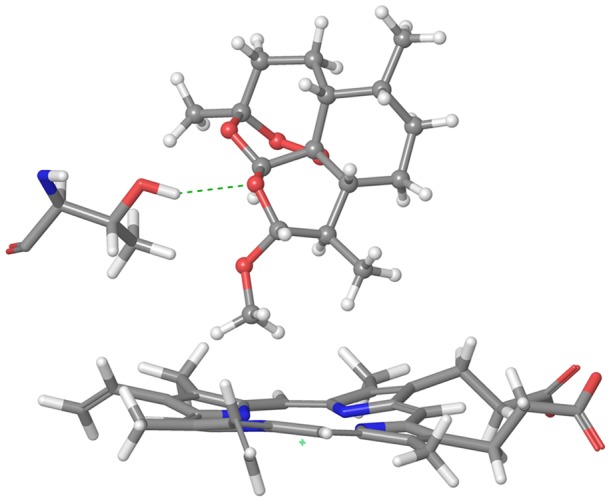
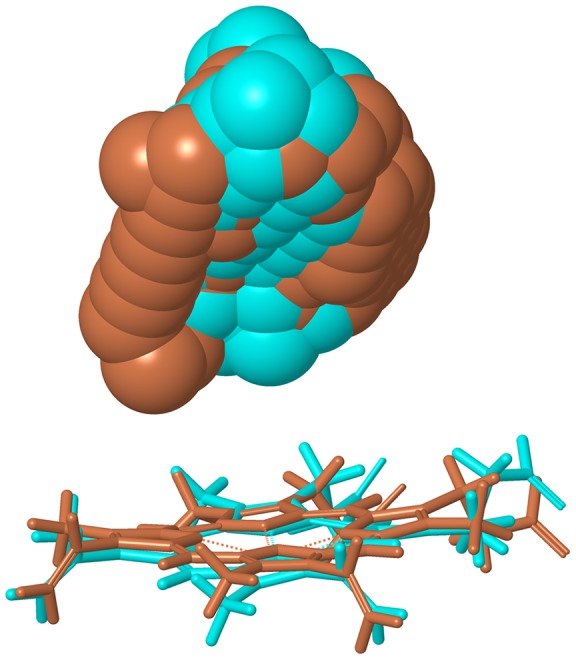
In this study, we investigated the influence of single nucleotide polymorphisms on the conformation of mutated cytochrome P450 (CYP) 2B6 proteins using molecular dynamics (MD) simulation. Some of these mutations influence drug metabolism activities, leading to individual variations in drug efficacy and pharmacokinetics. Using computational docking, we predicted the structure of the complex between the antimalarial agent artemether and CYP2B6 whose conformations were obtained by MD simulation. The simulation demonstrated that the entire structure of the protein changes even when a single residue is mutated. Moreover, the structural flexibility is affected by the mutations and it may influence the enzyme activity. The results suggest that some of the inactive mutants cannot recognize artemether due to structural changes caused by the mutation.
Conflict of interest statement
Figures
Similar articles
-
Coumarin Derivatives as Substrate Probes of Mammalian Cytochromes P450 2B4 and 2B6: Assessing the Importance of 7-Alkoxy Chain Length, Halogen Substitution, and Non-Active Site Mutations.Biochemistry. 2016 Apr 5;55(13):1997-2007. doi: 10.1021/acs.biochem.5b01330. Epub 2016 Mar 24. Biochemistry. 2016. PMID: 26982502 Free PMC article.
-
Effects of the selected cytochrome P450 oxidoreductase genetic polymorphisms on cytochrome P450 2B6 activity as measured by bupropion hydroxylation.Pharmacogenet Genomics. 2016 Feb;26(2):80-7. doi: 10.1097/FPC.0000000000000190. Pharmacogenet Genomics. 2016. PMID: 26580670
-
Common and Distinct Interactions of Chemical Inhibitors with Cytochrome P450 CYP1A2, CYP2A6 and CYP2B6 Enzymes.Drug Metab Lett. 2016;10(1):56-64. doi: 10.2174/1872312810666151204002456. Drug Metab Lett. 2016. PMID: 26648056
-
Multidisciplinary Insights into the Structure-Function Relationship of the CYP2B6 Active Site.Drug Metab Dispos. 2023 Mar;51(3):369-384. doi: 10.1124/dmd.122.000853. Epub 2022 Nov 23. Drug Metab Dispos. 2023. PMID: 36418184 Review.
-
Substrate specificity, regulation, and polymorphism of human cytochrome P450 2B6.Curr Drug Metab. 2009 Sep;10(7):730-53. doi: 10.2174/138920009789895534. Curr Drug Metab. 2009. PMID: 19702527 Review.
Cited by
-
Molecular Dynamics Simulations to Investigate the Influences of Amino Acid Mutations on Protein Three-Dimensional Structures of Cytochrome P450 2D6.1, 2, 10, 14A, 51, and 62.PLoS One. 2016 Apr 5;11(4):e0152946. doi: 10.1371/journal.pone.0152946. eCollection 2016. PLoS One. 2016. PMID: 27046024 Free PMC article.
-
Deciphering Structural Alterations Associated with Activity Reductions of Genetic Polymorphisms in Cytochrome P450 2A6 Using Molecular Dynamics Simulations.Int J Mol Sci. 2021 Sep 19;22(18):10119. doi: 10.3390/ijms221810119. Int J Mol Sci. 2021. PMID: 34576282 Free PMC article.
-
Methadone pharmacogenetics in vitro and in vivo: Metabolism by CYP2B6 polymorphic variants and genetic variability in paediatric disposition.Br J Clin Pharmacol. 2022 Nov;88(11):4881-4893. doi: 10.1111/bcp.15393. Epub 2022 Jun 20. Br J Clin Pharmacol. 2022. PMID: 35538637 Free PMC article.
-
Discovery of a regioselectivity switch in nitrating P450s guided by molecular dynamics simulations and Markov models.Nat Chem. 2016 May;8(5):419-25. doi: 10.1038/nchem.2474. Epub 2016 Mar 21. Nat Chem. 2016. PMID: 27102675 Free PMC article.
-
Stereoselective Bupropion Hydroxylation by Cytochrome P450 CYP2B6 and Cytochrome P450 Oxidoreductase Genetic Variants.Drug Metab Dispos. 2020 Jun;48(6):438-445. doi: 10.1124/dmd.119.090407. Epub 2020 Apr 1. Drug Metab Dispos. 2020. PMID: 32238417 Free PMC article.
References
-
- Nelson DR, Kamataki T, Waxman DJ, Guengerich FP, Estabrook RW, et al. (1993) The P450 superfamily: Update on new sequences, gene mapping, accession numbers, early trivial names of enzymes, and nomenclature. DNA Cell Biol 12: 1–51. - PubMed
-
- Wolkers J, Witkamp RF, Nijimeijer SM, Burkow IC, de Groene EM, et al. (1998) Phase Ι and phase ΙΙ enzyme activities in Ringed seals (Phoca hispida): characterization of hepatic cytochrome P450 by activity patterns, inhibition studies, mRNA analyses, and western blotting. Aquat Toxicol 44: 103–105.
-
- Meunier B, de Visser SP, Shaik S (2004) Mechanism of oxidation reactions catalyzed by cytochrome P450 enzymes. Chem Rev 104: 3947–3980. - PubMed
-
- Munro AW, Girvan HM, McLean KJ (2007) Variations on a (t)heme – novel mechanisms, redox partners and catalytic functions in the cytochrome P450 superfamily. Nat Prod Rep 24: 585–609. - PubMed
-
- Shaik S, de Visser SP (2005) Computational approaches to cytochrome P450 function, In: de Montellano PRO, editor. Cytochrome P450: structure, mechanism, and biochemistry (3rd ed.). New York: Kluwer Academic/Plenum Publishers. pp. 45–85.
Publication types
MeSH terms
Substances
LinkOut - more resources
Full Text Sources
Other Literature Sources
