. 2014 Jul;34(14):2650-9.
doi: 10.1128/MCB.01567-13.

Fidelity of histone gene regulation is obligatory for genome replication and stability

Fidelity of histone gene regulation is obligatory for genome replication and stability

Prachi N Ghule et al. Mol Cell Biol. 2014 Jul.

Abstract

Fidelity of chromatin organization is crucial for normal cell cycle progression, and perturbations in packaging of DNA may predispose to transformation. Histone H4 protein is the most highly conserved chromatin protein, required for nucleosome assembly, with multiple histone H4 gene copies encoding identical protein. There is a long-standing recognition of the linkage of histone gene expression and DNA replication. A fundamental and unresolved question is the mechanism that couples histone biosynthesis with DNA replication and fidelity of cell cycle control. Here, we conditionally ablated the obligatory histone H4 transcription factor HINFP to cause depletion of histone H4 in mammalian cells. Deregulation of histone H4 results in catastrophic cellular and molecular defects that lead to genomic instability. Histone H4 depletion increases nucleosome spacing, impedes DNA synthesis, alters chromosome complement, and creates replicative stress. Our study provides functional evidence that the tight coupling between DNA replication and histone synthesis is reciprocal.


Figures

FIG 1
FIG 1
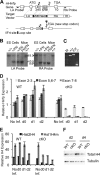
Functional characterization of conditional HINFP mutant protein in vitro. (A) IF microscopy of U2-OS cells transfected with Xpress-tagged HINFP expression vectors: full-length (FL-P) mouse HINFP, mutant HINFP (d6789-P) lacking exons 6 to 9, and empty vector (EV). The d6789-P mutant HINFP protein is mislocalized. (B) EMSA using IVTT proteins generated from the vectors described above shows mutated HINFP (d6789-P) lacks DNA binding: lane 1, EV; lanes 2 to 5, FL-P; and lanes 6 to 9, d6789-P with or without competitor (100×) oligonucleotides. (C) Western blot analysis of IVTT proteins: lane 1, full-length HINFP protein; lane 2, d6789-P HINFP protein lacking exons 6 to 9. (D) Relative luciferase activity of wild-type histone H4n/L promoter was measured after cotransfection with NPAT alone or NPAT with WT or mutated HINFP. The mutated HINFP reduces NPAT-associated activity of histone H4 promoter elements.
FIG 2
FIG 2
Conditional ablation of transcription factor HINFP inactivates histone H4 expression. (A) Schematic diagram showing targeted Hinfp locus to generate conditional Hinfp knockout mice. The arrow indicates the recombined locus that generates a conditional Hinfp-null mutation (−, null). Ovals indicate right- and left-arm probes for Southern blotting. Arrowheads represent genotyping primers for PCR. (B) Autoradiographs of Southern blot analysis of mouse ES cell clones (wild type [+/+] and +/FN) and mouse tail DNA (+/FN, FN/FN, and +/+) that were hybridized to either left- or right-arm probes: 18.0-kb WT allele and either 10.5-kb (LA probe) or 9.6-kb (RA probe) targeted allele. (C) PCR genotyping analysis of DNA from MEFs of wild-type (+/+) and Hinfp-null pups (F/F) with or without infection with Ad5CMVCre-EGFP virus using primers a and b shown in panel A. Lane 1, marker; lane 2, WT MEFs; lane 3, F/F MEFs without Cre infection; and lane 4, Hinfp-null MEFs after Cre treatment. (D and E) RT-qPCR analysis of WT and cKO MEFs without (No Inf.) or with Cre infection (d0 to d2) showing expression of Hinfp mRNA for multiple exons (exons 2-3, 5, 6-7, 7-8) (D) and two histone H4 genes (Hist2H4 [H4] and Hist1H4m [H4m]) (E). Removal of Hinfp causes a marked decrease in histone H4 gene expression. (F) Western blot analysis of WT and cKO MEFs at d2 and d4 shows reduction of total H4 protein in Hinfp-null cells (see also Fig. S2 in the supplemental material).
FIG 3
FIG 3
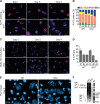
Loss of Hinfp causes deregulation of cell proliferation. WT and cKO MEFs (GFP sorted) were cultured for 4 days. (A) WT and cKO MEFs plated at 0.35 × 10⁶/60-mm dish were harvested at different time points (d0 to d4) to analyze proliferation in culture. cKO cells show severe delay in proliferation. (B) Cell cycle analysis by flow cytometry for DNA content shows increased sub-G1 population, altered S phase, as well as polyploid cells in cKO MEFs. (C) Senescence-associated β-galactosidase (SA β-Gal) activity was measured at d2 and d4. There is an obvious increase in SA β-Gal-specific staining in cKO MEFs that is enhanced at d4. (D) The distribution of HLBs was determined by staining for NPAT (red). IF microscopy revealed an increase in the fraction of cells with multiple NPAT foci (white arrowheads) or diffused NPAT staining (red arrowheads) in cKO MEFs at d2 and d4. The nuclei were counterstained with DAPI (blue). Scale bar, 50 μm. (E) Quantitation of NPAT staining patterns in WT and cKO MEFs at d2 and d4. Bar graph shows the percentage of cells with specific numbers of NPAT foci. A total of 200 nuclei were counted from two biological replicates per sample for each time point.
FIG 4
FIG 4
Hinfp ablation results in atypical nuclear and chromosomal morphology. WT and cKO MEFs (post-GFP sorting) were harvested at d1, d2, or d4 in culture. (A) IF microscopy shows obvious differences in nuclear size and shape between WT and cKO MEFs from d2 onwards. Nuclei stained with DAPI (gray) show clear increase in size after removal of Hinfp. Scale bar, 50 μm. (B) IF microscopy of MEFs stained with α-tubulin (red) show increased presence of binucleated cells (arrowheads) in cKO MEFs. The insets indicate percentage of binucleate cells. Scale bar, 50 μm. (C) Mitotic preparations of MEFs at d2 were subjected to DNA-FISH with probes against mouse minor satellite (top) or major satellite (bottom) regions. Hinfp-ablated cells show obvious increase in the chromosome complement. Scale bar, 20 μm. (D) Quantitation of mitotic cells from WT and cKO MEFs at d2 probed with satellite DNA was performed to calculate percent distribution of diploid (∼2n) and polyploid (>2n) chromosome complement. A total of 50 metaphases were counted per sample. The bar graph shows higher percentage of polyploidy in cKO MEFs than in WT MEFs. (E) The microtubules of asynchronous WT and cKO MEFs at d2 were stained with α-tubulin (red) and analyzed by IF microscopy. The micrograph shows the presence of mitotic cells with multipolar spindles in cKO MEFs.
FIG 5
FIG 5
Loss of Hinfp causes S-phase delay. (A) IF staining of Ki-67 (red) as the cell cycle marker was carried out on WT and cKO MEFs. The nuclei were counterstained with DAPI (blue). Scale bar, 50 μm. (B) Quantitation of different Ki-67 patterns revealed that Hinfp-null MEFs show a higher percentage of G0 cells and persistence of cells with the S-phase pattern. (C) Active DNA synthesis was measured by pulse-labeling of WT and cKO MEFs with BrdU (red). cKO cells at d4 show a substantial decrease in BrdU incorporation. Scale bar, 50 μm. (D) Quantitation of percentage of S phase (BrdU-positive cells) shows a marked decrease in active DNA synthesis (5% in cKO versus 21% in WT) at d4. A total of 400 nuclei were counted from two biological replicates for panels B and D. (E) WT and cKO MEFs were subjected to drug-induced PCC assay. DNA was stained with DAPI (blue). A higher incidence of S-phase-specific (arrowheads) PCC pattern was observed in cKO MEFs. Insets indicate percentage of S-phase-specific PCC patterns. (F) Nucleosome repeat length (NRL) assay of MEF DNA at d4 shows differences in the nucleosome ladder by gel electrophoresis. The images were analyzed using ImageJ software. Line scan analysis revealed broadening of bands and increased nucleosomal spacing in cKO MEFs.
FIG 6
FIG 6
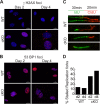
Hinfp is required for genomic stability and maintenance of DNA replication. WT and cKO MEFs were analyzed for factors associated with double-strand DNA damage by IF microscopy. (A) γ-H2AX S-139 (red); scale bar, 20 μm; (B) 53BP1 (red); scale bar, 20 μm. Nuclei were counterstained with DAPI (blue). cKO MEFs show a higher percentage of cells with both γ-H2AX and 53BP1 foci. (C) DNA fiber assay. WT and cKO MEFs were consecutively labeled with iododeoxyuridine (IdU; green) and chlorodeoxyuridine (CldU; red) at d2 and d4. Representative images of elongating and stalled forks are shown. Hinfp-null MEFs have a higher incidence of stalled replication forks than WT. (D) The bar graph represents percentage of stalled replication forks observed in WT and cKO MEFs at d2 and d4. There is increased frequency of stalled forks in Hinfp-null MEFs.

Similar articles

Cited by

References

    1. Luger K. 2006. Dynamic nucleosomes. Chromosome Res. 14:5–16. 10.1007/s10577-005-1026-1 - DOI - PubMed
    1. Wolffe A. 1995. Chromatin: structure and function. Academic Press, London, United Kingdom
    1. Stein GS. 1984. Histone genes: structure, organization, and regulation. John Wiley & Sons, New York, NY
    1. Plumb M, Stein J, Stein G. 1983. Influence of DNA synthesis inhibition on the coordinate expression of core human histone genes during S phase. Nucleic Acids Res. 11:7927–7945. 10.1093/nar/11.22.7927 - DOI - PMC - PubMed
    1. Sittman DB, Graves RA, Marzluff WF. 1983. Histone mRNA concentrations are regulated at the level of transcription and mRNA degradation. Proc. Natl. Acad. Sci. U. S. A. 80:1849–1853. 10.1073/pnas.80.7.1849 - DOI - PMC - PubMed

Publication types

LinkOut - more resources