. 2014 Jul;34(14):2566-80.
doi: 10.1128/MCB.00411-14.

Synapsis alters RAG-mediated nicking at Tcrb recombination signal sequences: implications for the “beyond 12/23” rule

Synapsis alters RAG-mediated nicking at Tcrb recombination signal sequences: implications for the “beyond 12/23” rule

Joydeep K Banerjee et al. Mol Cell Biol. 2014 Jul.

Abstract

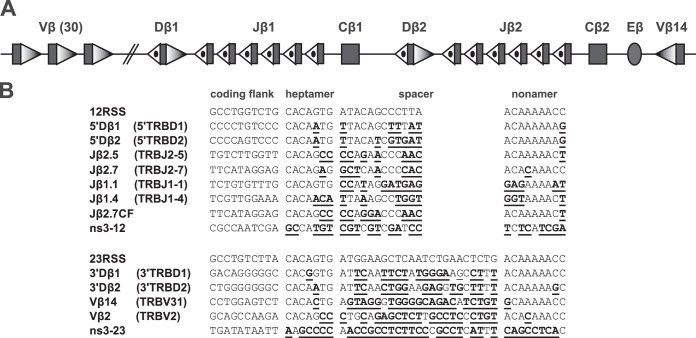
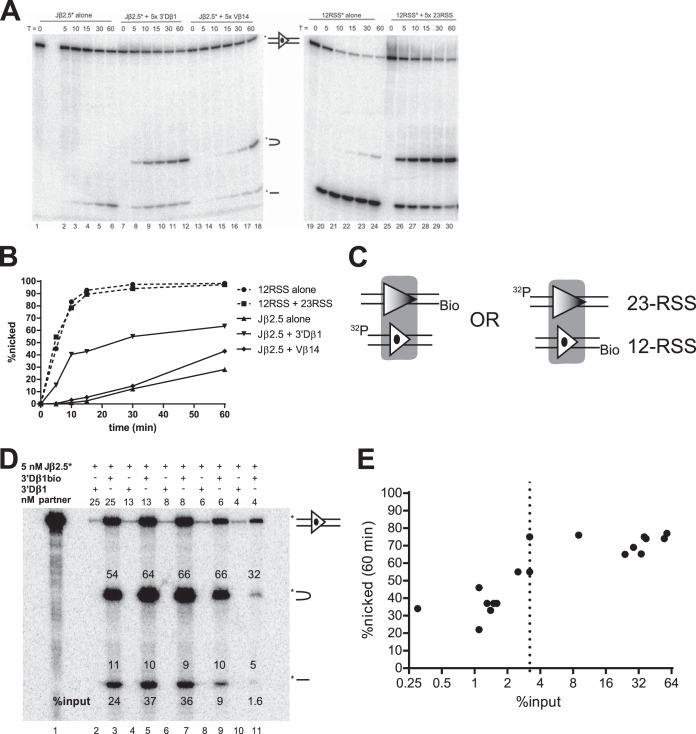
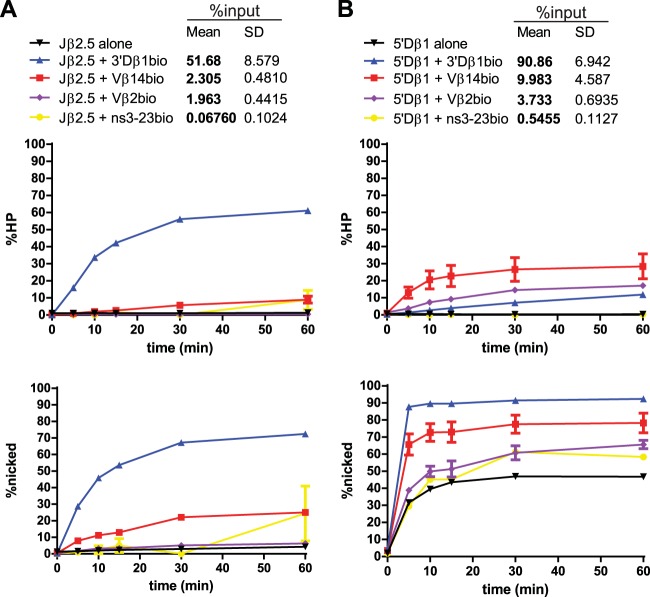
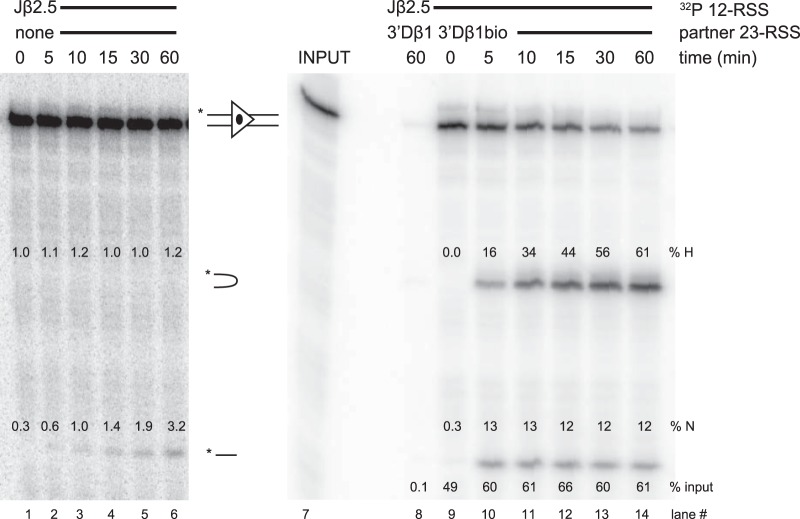
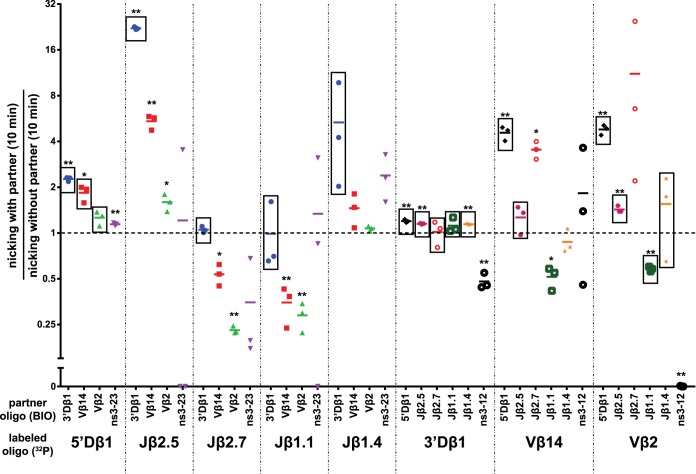
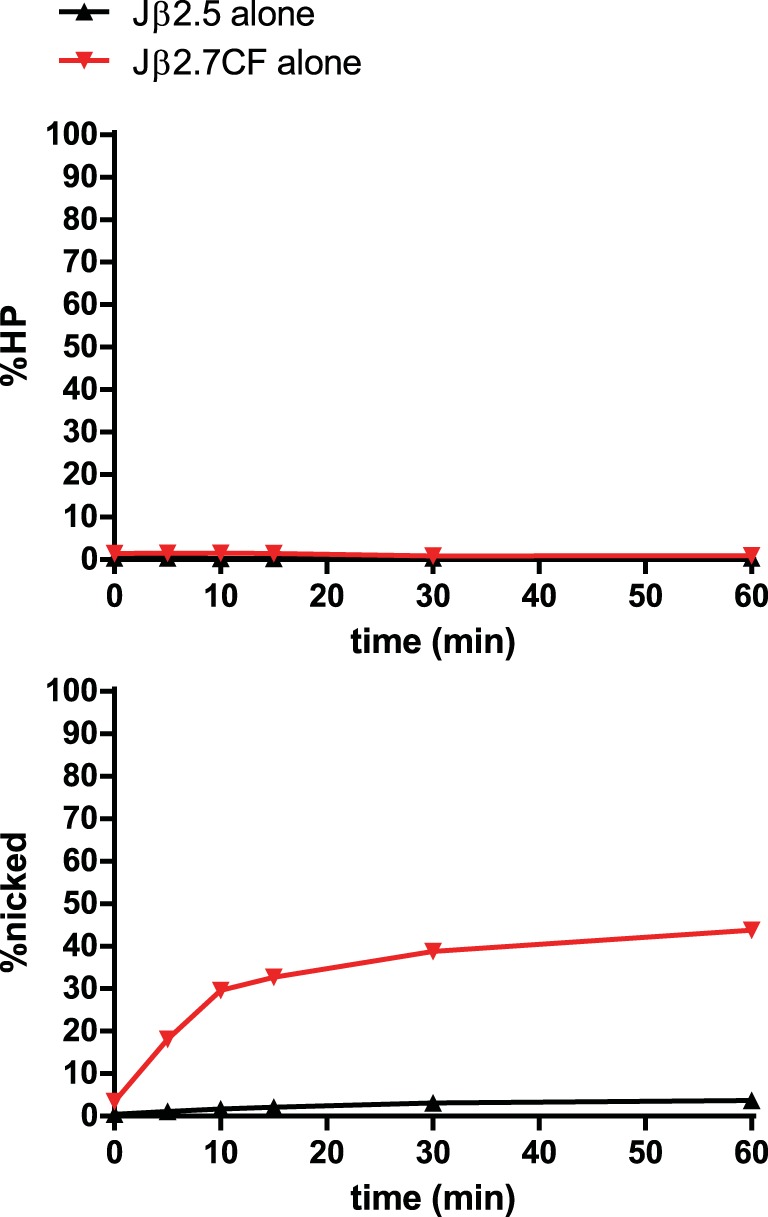
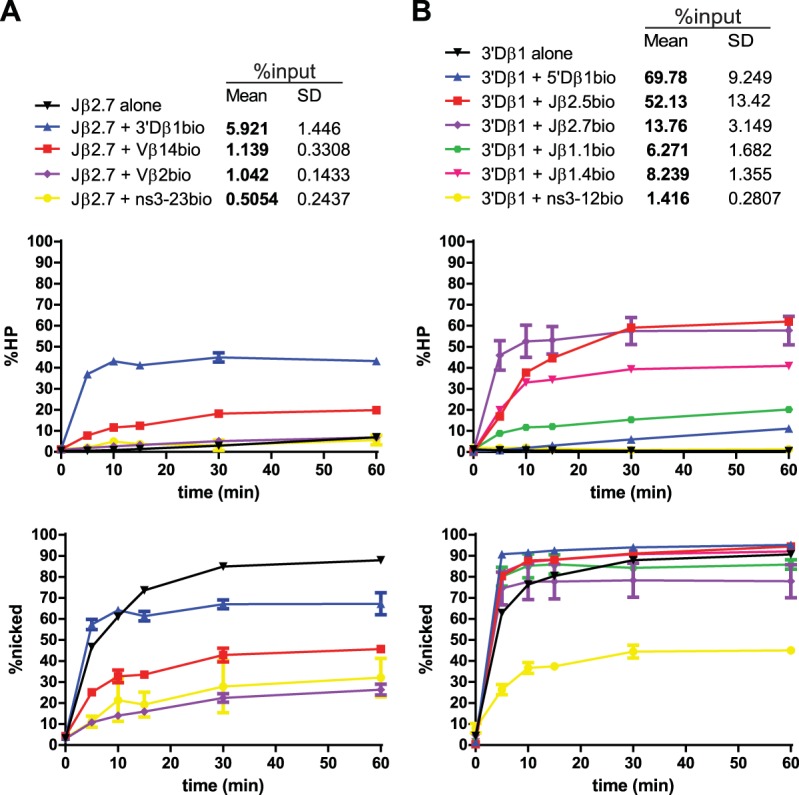
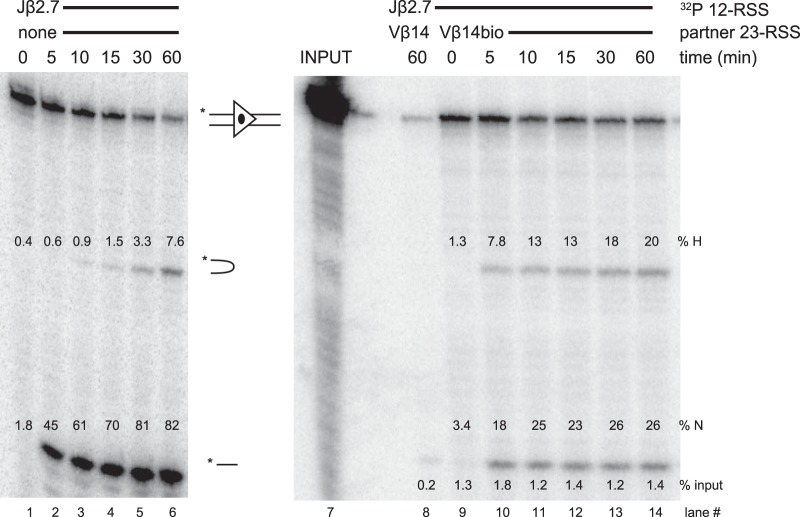
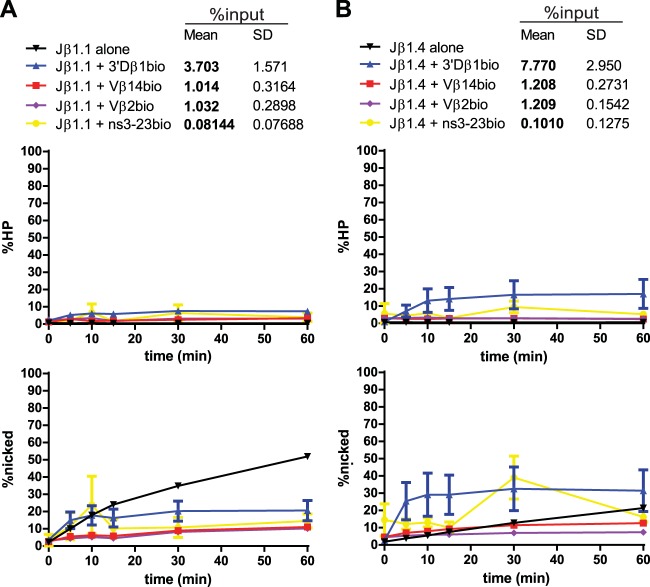
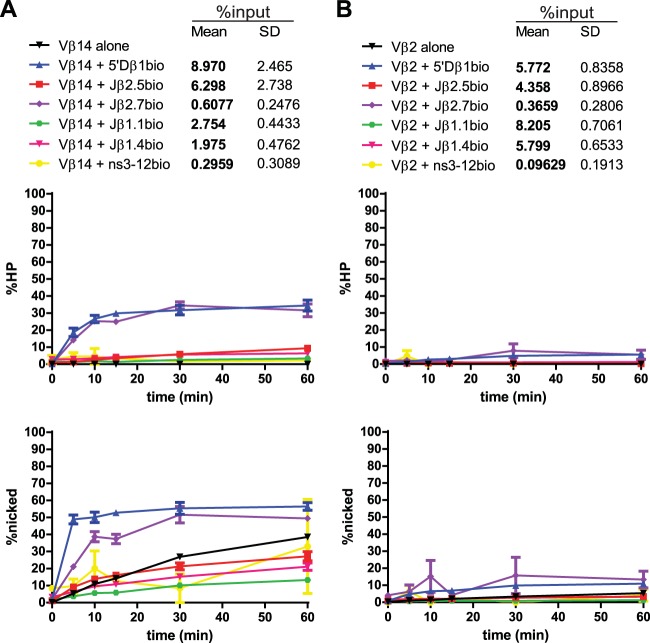
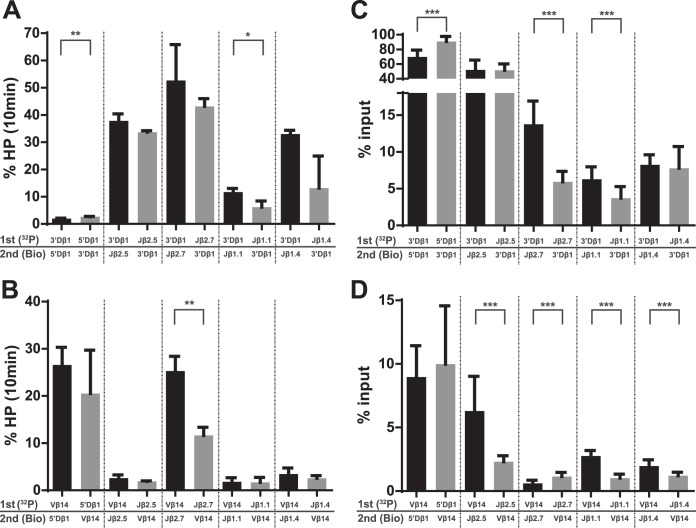
At the Tcrb locus, Vβ-to-Jβ rearrangement is permitted by the 12/23 rule but is not observed in vivo, a restriction termed the “beyond 12/23” rule (B12/23 rule). Previous work showed that Vβ recombination signal sequences (RSSs) do not recombine with Jβ RSSs because Jβ RSSs are crippled for either nicking or synapsis. This result raised the following question: how can crippled Jβ RSSs recombine with Dβ RSSs? We report here that the nicking of some Jβ RSSs can be substantially stimulated by synapsis with a 3′Dβ1 partner RSS. This result helps to reconcile disagreement in the field regarding the impact of synapsis on nicking. Furthermore, our data allow for the classification of Tcrb RSSs into two major categories: those that nick quickly and those that nick slowly in the absence of a partner. Slow-nicking RSSs can be stimulated to nick more efficiently upon synapsis with an appropriate B12/23 partner, and our data unexpectedly suggest that fast-nicking RSSs can be inhibited for nicking upon synapsis with an inappropriate partner. These observations indicate that the RAG proteins exert fine control over every step of V(D)J cleavage and support the hypothesis that initial RAG binding can occur on RSSs with either 12- or 23-bp spacers (12- or 23-RSSs, respectively).


Figures

FIG 1
FIG 1
Tcrb locus. (A) The general structure of the Tcrb locus is depicted schematically and not to scale; rectangles represent gene segments, an oval represents the Eβ enhancer, shaded triangles represent 23-RSSs, and dotted triangles represent 12-RSSs. (B) Alignment of coding flank, heptamer, spacer, and nonamer sequences of the RSSs discussed in the text. For each RSS, any differences from consensus are underlined. Table 1 gives the full sequence of each oligonucleotide used. GenBank gene segment names (http://www.ncbi.nlm.nih.gov/gene/21577) are shown in parentheses for endogenous RSSs.
FIG 2
FIG 2
Development of a PC-only cleavage assay. (A) In-solution cleavage assays were performed with either 5′ top-strand-radiolabeled Jβ2.5 (Jβ2.5*) or radiolabeled consensus 12-RSS (12RSS*) in the presence or absence of the indicated partner oligonucleotide and for the indicated number of minutes. Reaction products were separated by denaturing PAGE. Uncleaved, hairpinned, and nicked products are indicated schematically and in respective order, top to bottom, by the symbols shown between lanes 18 and 19. (B) Quantitation of nicking from the experiment shown in panel A. (C) PC-only cleavage assay strategy. One partner oligonucleotide is biotinylated (Bio) on the 5′ end of the bottom strand, while the other is radiolabeled (32P) on the 5′ end of the top strand. (D) Representative experiment used to determine the 3% input threshold. Binding reactions were performed using 5 nM radiolabeled Jβ2.5 and the indicated concentration of either biotinylated 3′Dβ1 (3′Dβ1bio) or unbiotinylated 3′Dβ1 (3′Dβ1). Purification of PCs proceeded as described in Materials and Methods, and cleavage was allowed to occur for 60 min. Numbers above the bands indicate the percentage of the signal in the lane that is present in each band, and the bottom numbers indicate the percentage of the input DNA that was captured on the magnetic beads. (E) Quantitation of all PC-only assays on Jβ2.5*-3′Dβ1 PCs (logarithmic x axis). The 3% input threshold is indicated by a dotted line.
FIG 3
FIG 3
Jβ2.5 and 5′Dβ1 nicking is stimulated by partner substrates. (A) Quantitation of time course experiments on Jβ2.5. All reactions were repeated three times. The top graph shows percent hairpinning (HP) over time, while the bottom shows percent nicking over time. The table at the top of the panel provides the legend for the graphs and includes the mean and standard deviation (SD) of the percentage of input radioactivity recovered for the indicated RSS pair. In these and all similar plots, each data point represents the mean of three independent values and is plotted with an error bar that represents the standard error of the mean (SEM). In many cases, the error bar is so small that it is not easily visible. (B) Quantitation of time course experiments on 5′Dβ1.
FIG 4
FIG 4
Representative Jβ2.5 cleavage gels. Lanes 1 to 6 show a cleavage time course (in-solution reaction) of a radiolabeled (32P) Jβ2.5 RSS substrate with no partner RSS, while lanes 8 to 14 show cleavage in purified Jβ2.5-3′Dβ1 PCs. Lane 8 shows the nonbiotinylated partner control. Lane 7 shows an input lane, representing 33% of the total radiolabeled Jβ2.5 used in binding reactions. Percentages of input radioactivity pulled down (% input), hairpin product (% H), and nicked product (% N) are indicated.
FIG 5
FIG 5
Summary of nicking alterations in purified PCs. The percentage of nicking at the 10-min time point for the indicated RSS pairs (n = 3) was divided by the average percentage of nicking at the 10-min time point for the indicated radiolabeled RSS in the absence of partner, and the quotient was plotted on the y axis (logarithmic). Points enclosed in a rectangle indicate an RSS pair that was, on average, purified above the 3% input threshold; one asterisk represents an RSS pair whose 10-min nicking ratio significantly differed from 1 (P < 0.05), and two asterisks represent a highly significant difference (P < 0.01).
FIG 6
FIG 6
In-solution cleavage assay of Jβ2.5 and Jβ2.7CF. Jβ2.7CF is identical in sequence to Jβ2.5 except for its coding flank, which has been replaced by that of Jβ2.7.
FIG 7
FIG 7
Jβ2.7 and 3′Dβ1 PC-only cleavage time courses. Data are presented as described in the legend to Fig. 3A. (A) Jβ2.7 nicking is inhibited by partner substrates. (B) 3′Dβ1 nicking is largely unaffected by partner substrates.
FIG 8
FIG 8
Representative Jβ2.7 cleavage gels. Lanes 1 to 6 show a cleavage time course of a radiolabeled Jβ2.7 RSS substrate with no partner RSS, while lanes 8 to 14 show cleavage in purified Jβ2.7-Vβ14 PCs. Lane 8 shows the nonbiotinylated partner control. Lane 7 shows an input lane, representing 33% of the total radiolabeled Jβ2.7 used in binding reactions. Percentages of input radioactivity pulled down (% input), hairpin product (% H), and nicked product (% N) are indicated.
FIG 9
FIG 9
Jβ1.1 and Jβ1.4 PC-only cleavage time courses. Data are presented as described in the legend to Fig. 3A. (A) Jβ1.1 nicking is inhibited by partner substrates. (B) Jβ1.4 nicking is moderately stimulated by synapsis with 3′Dβ1 and unaffected by synapsis with Vβ14 or Vβ2.
FIG 10
FIG 10
Vβ14 and Vβ2 PC-only cleavage time courses. Data are presented as described in the legend to Fig. 3A. (A) Vβ14 nicking can be stimulated, unaffected, or inhibited by synapsis with various partner substrates. (B) Vβ2 nicking proceeds inefficiently and is unaffected by synapsis with any of the partner substrates tested.
FIG 11
FIG 11
Comparison of hairpin formation and efficiencies of pulldown of PCs containing 3′Dβ1 or Vβ14. Radiolabeled RSSs (32P) were incubated with protein for 1 min before the addition of biotinylated (Bio) partner and subsequent incubation for 10 min, as described in Materials and Methods. P values were calculated by a two-tailed t test with Welch's correction. *, P < 0.05; **, P < 0.01; ***, P < 0.0001. (A) The magnitude of hairpin formation at 10 min is shown for the indicated substrate pairs containing 3′Dβ1. (B) The magnitude of hairpin formation at 10 min is shown for the indicated substrate pairs containing Vβ14. (C) The efficiency of radiolabeled RSS recovery (% input) is indicated for the indicated substrate pairs containing 3′Dβ1. (D) The efficiency of radiolabeled RSS recovery (% input) is indicated for the indicated substrate pairs containing Vβ14.

References

    1. Schatz DG, Oettinger MA, Baltimore D. 1989. The V(D)J recombination activating gene, RAG-1. Cell 59:1035–1048. 10.1016/0092-8674(89)90760-5 - DOI - PubMed
    1. Oettinger MA, Schatz DG, Gorka C, Baltimore D. 1990. RAG-1 and RAG-2, adjacent genes that synergistically activate V(D)J recombination. Science 248:1517–1523. 10.1126/science.2360047 - DOI - PubMed
    1. Gellert M. 2002. V(D)J recombination: RAG proteins, repair factors, and regulation. Annu. Rev. Biochem. 71:101–132. 10.1146/annurev.biochem.71.090501.150203 - DOI - PubMed
    1. Fugmann SD, Lee AI, Shockett PE, Villey IJ, Schatz DG. 2000. The RAG proteins and V(D)J recombination: complexes, ends, and transposition. Annu. Rev. Immunol. 18:495–527. 10.1146/annurev.immunol.18.1.495 - DOI - PubMed
    1. van Gent DC, Hiom K, Paull TT, Gellert M. 1997. Stimulation of V(D)J cleavage by high mobility group proteins. EMBO J. 16:2665–2670. 10.1093/emboj/16.10.2665 - DOI - PMC - PubMed

Publication types

LinkOut - more resources