Development of a comprehensive prognostic index for patients with chronic lymphocytic leukemia
- PMID: 24797299
- PMCID: PMC4260976
- DOI: 10.1182/blood-2014-02-556399
Development of a comprehensive prognostic index for patients with chronic lymphocytic leukemia
Abstract
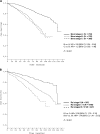
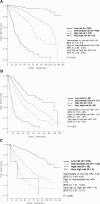
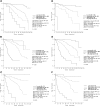
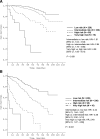
In addition to clinical staging, a number of biomarkers predicting overall survival (OS) have been identified in chronic lymphocytic leukemia (CLL). The multiplicity of markers, limited information on their independent prognostic value, and a lack of understanding of how to interpret discordant markers are major barriers to use in routine clinical practice. We therefore performed an analysis of 23 prognostic markers based on prospectively collected data from 1948 CLL patients participating in phase 3 trials of the German CLL Study Group to develop a comprehensive prognostic index. A multivariable Cox regression model identified 8 independent predictors of OS: sex, age, ECOG status, del(17p), del(11q), IGHV mutation status, serum β2-microglobulin, and serum thymidine kinase. Using a weighted grading system, a prognostic index was derived that separated 4 risk categories with 5-year OS ranging from 18.7% to 95.2% and having a C-statistic of 0.75. The index stratified OS within all analyzed subgroups, including all Rai/Binet stages. The validity of the index was externally confirmed in a series of 676 newly diagnosed CLL patients from Mayo Clinic. Using this multistep process including external validation, we developed a comprehensive prognostic index with high discriminatory power and prognostic significance on the individual patient level. The studies were registered as follows: CLL1 trial (NCT00262782, http://clinicaltrials.gov), CLL4 trial (ISRCTN 75653261, http://www.controlled-trials.com), and CLL8 trial (NCT00281918, http://clinicaltrials.gov).
© 2014 by The American Society of Hematology.
Figures


Comment in
-
A new prognostic score for CLL.Blood. 2014 Jul 3;124(1):1-2. doi: 10.1182/blood-2014-05-575407. Blood. 2014. PMID: 24993873
References
-
- Müller-Hermelink H, Montserrat E, Catovsky D, Campo E, Harris N, Stein H. Chronic Lymphocytic Leukemia/small lymphocytic leukemia. In: Swerdlow SH, Campo E, Harris NL, et al., editors. World Health Organization Classification of Tumours, Pathology and Genetics of Tumours of Lymphoid Tissues Lyon. France: IARC; 2008. pp. 180–182.
-
- Dighiero G, Hamblin TJ. Chronic lymphocytic leukaemia. Lancet. 2008;371(9617):1017–1029. - PubMed
-
- Cramer P, Hallek M. Prognostic factors in chronic lymphocytic leukemia-what do we need to know? Nat Rev Clin Oncol. 2011;8(1):38–47. - PubMed
-
- Binet JL, Auquier A, Dighiero G, et al. A new prognostic classification of chronic lymphocytic leukemia derived from a multivariate survival analysis. Cancer. 1981;48(1):198–206. - PubMed
-
- Rai KR, Sawitsky A, Cronkite EP, Chanana AD, Levy RN, Pasternack BS. Clinical staging of chronic lymphocytic leukemia. Blood. 1975;46(2):219–234. - PubMed
Publication types
MeSH terms
Substances
Associated data
Grants and funding
LinkOut - more resources
Full Text Sources
Other Literature Sources
Medical

