. 2014 Jul;13(7):1676-89.
doi: 10.1074/mcp.M113.036301. Epub 2014 May 5.

The intraviral protein interaction network of hepatitis C virus

Affiliations

The intraviral protein interaction network of hepatitis C virus

Nicole Hagen et al. Mol Cell Proteomics. 2014 Jul.

Abstract

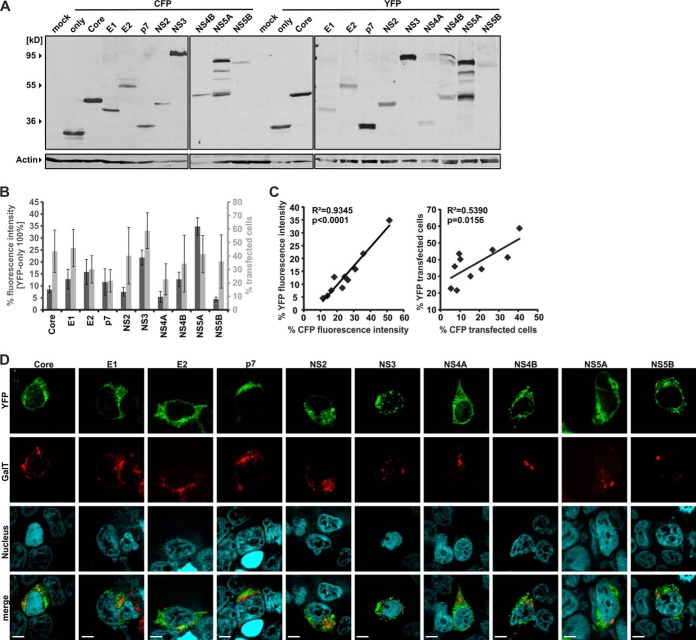
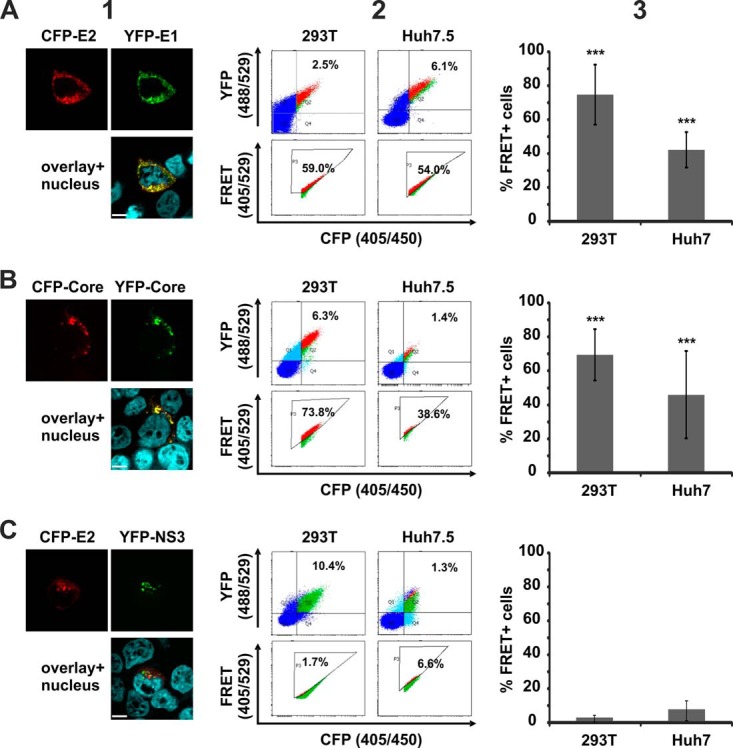
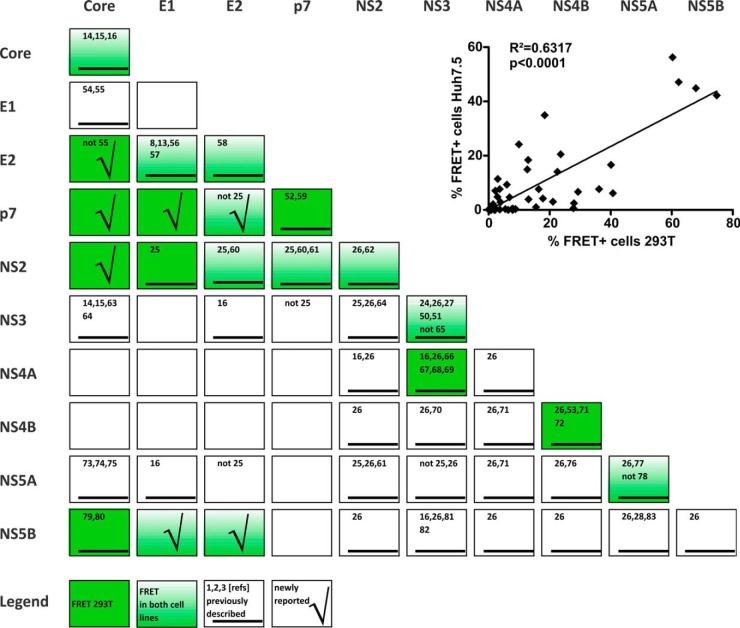
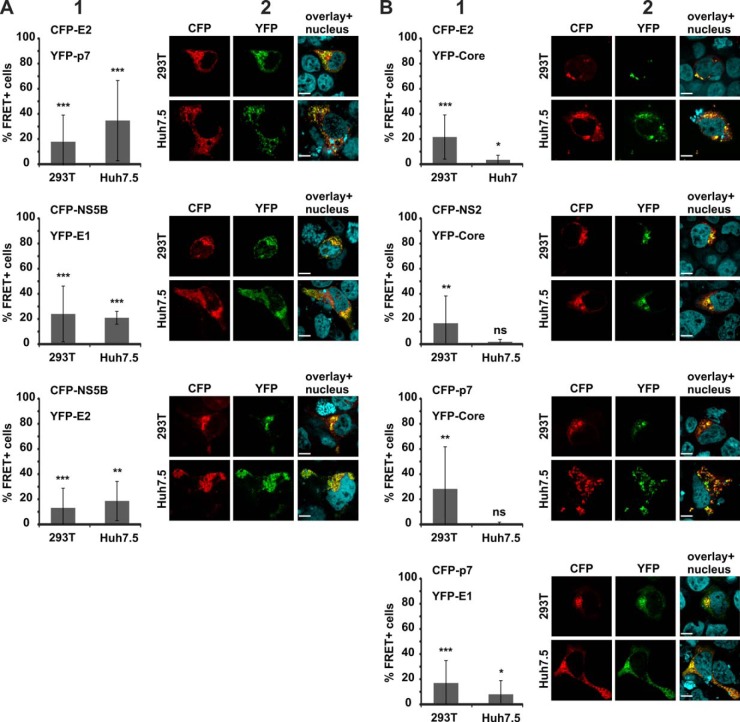
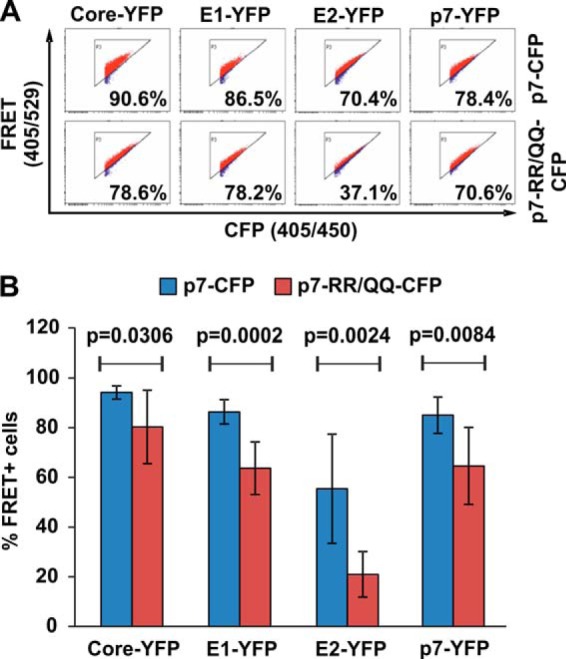
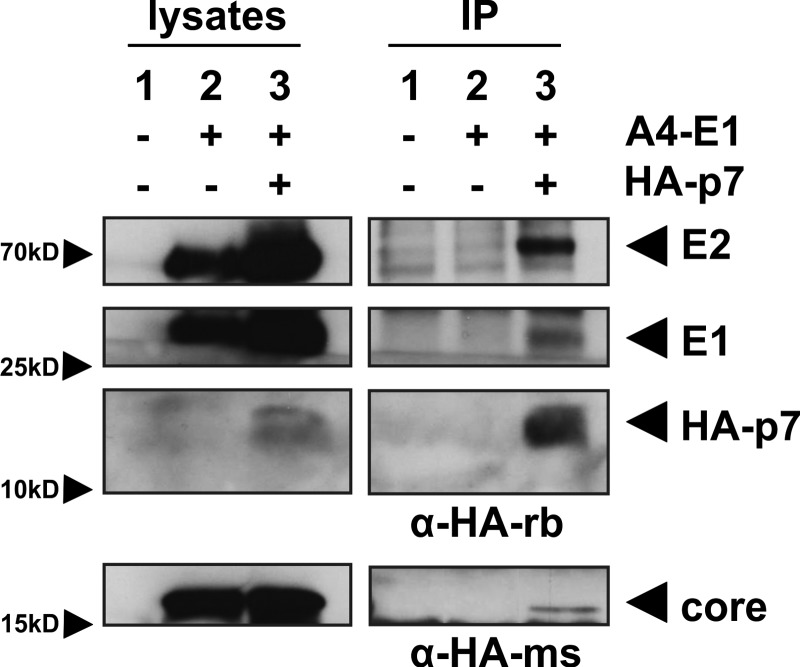
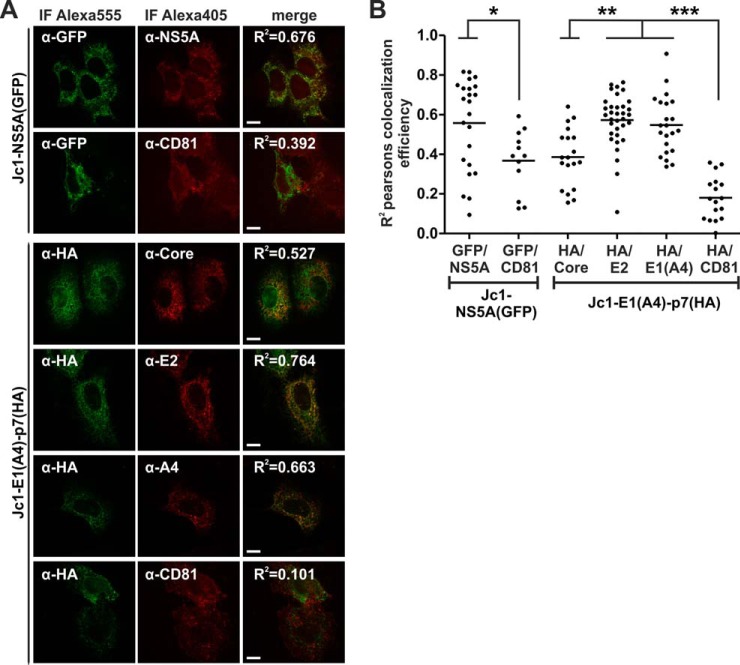
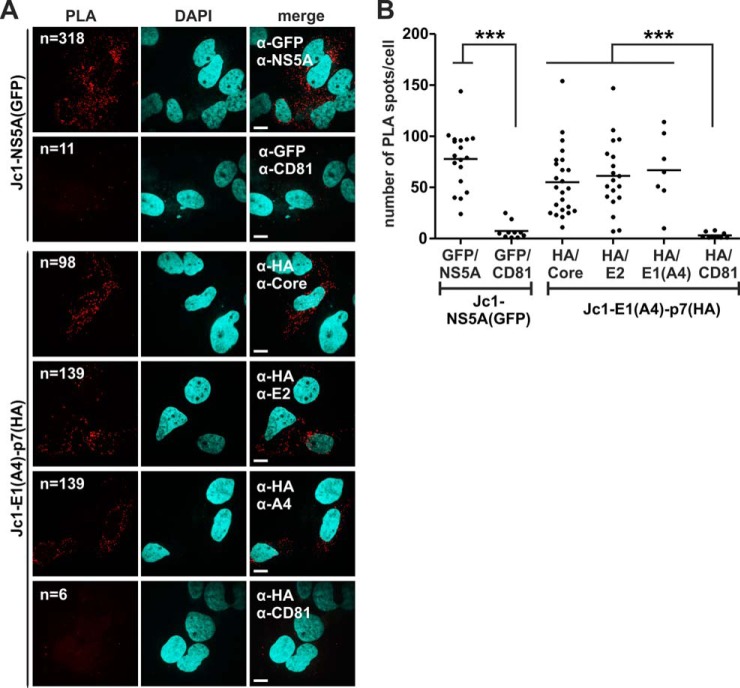
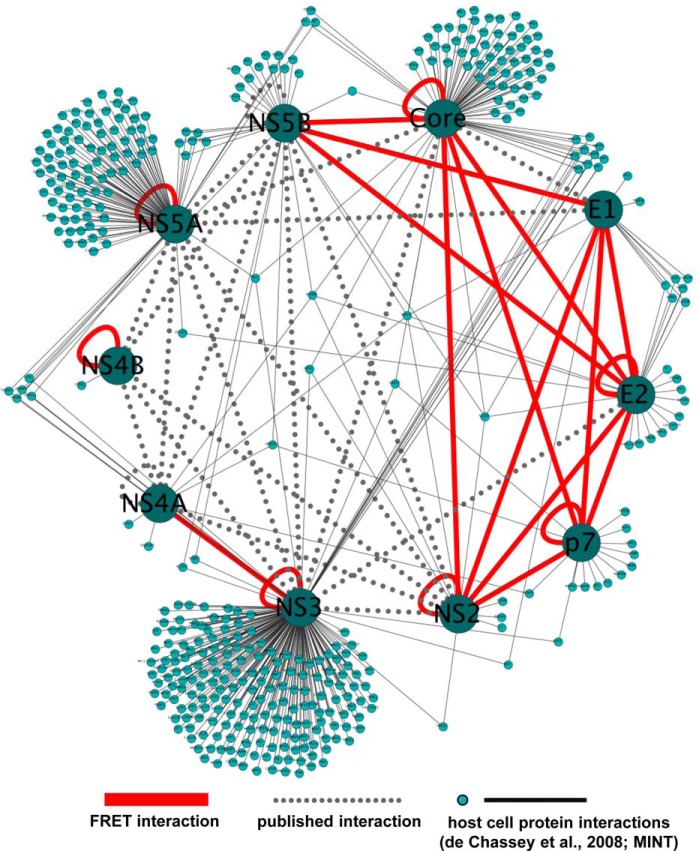
Hepatitis C virus (HCV) is a global health problem and one of the main reasons for chronic liver diseases such as cirrhosis and hepatocellular carcinoma. The HCV genome is translated into a polyprotein which is proteolytically processed into 10 viral proteins. The interactome of the HCV proteins with the host cell has been worked out; however, it remains unclear how viral proteins interact with each other. We aimed to generate the interaction network of these 10 HCV proteins using a flow-cytometry-based FRET assay established in our laboratory (Banning, C., Votteler, J., Hoffmann, D., Koppensteiner, H., Warmer, M., Reimer, R., Kirchhoff, F., Schubert, U., Hauber, J., and Schindler, M. (2010) A flow cytometry-based FRET assay to identify and analyse protein-protein interactions in living cells. PLoS One 5, e9344). HCV proteins were constructed as fusions with the chromophores CFP and YFP. All HCV fusions were expressed and localized to specific subcellular compartments, indicating that they were functional. FACS-FRET measurements identified a total of 20 interactions; 13 of these were previously described and have now been confirmed in living cells via our method. Among the seven novel protein binding pairs, HCV p7 plays a pivotal role. It binds to the HCV capsid protein Core and the two glycoproteins E1 and E2. These interplays were further demonstrated in the relevant context of Huh7.5 liver cells expressing infectious HCV. Our work demonstrates the feasibility of rapidly generating small interaction networks via FACS-FRET and defines the network of intra-HCV protein interactions. Furthermore, our data support an important role of p7 in HCV assembly.


Figures

Fig. 1.
Fig. 1.
Characterization of HCV-CFP and -YFP fusion proteins. All fusion proteins used in this study and characterized here carry an N-terminal chromophore tag. A, 300,000 293T cells were transfected with 5 μg of DNA of each HCV CFP/YFP fusion protein in a six-well format. Cellular lysates were generated for Western blotting, and expression of the fusion proteins was detected by an antibody specific for various chromophores including CFP and YFP. Actin was blotted as a loading control. B, 150,000 293T cells were transfected with 2.5 μg of DNA in a 12-well format. The mean fluorescence intensity and the percentage of cells transfected with the HCV-YFP fusion proteins were assessed via FACS analysis. Mean values and standard deviations were calculated from at least four independent transfections. C, transfections and measurements were done similarly to those described for B but with the HCV-CFP fusions. Then the mean values for fluorescence intensity and the percentage of transfected cells were correlated. Squared Pearson's correlation (R2) and corresponding p values were calculated with Graph Pad Prism 5.0. D, 293T cells transfected with the indicated HCV-YFP fusion proteins and GalT-CFP were grown on coverslips and embedded for confocal microscopy. The scale bar indicates a distance of 7 μm.
Fig. 2.
Fig. 2.
FRET analysis of specific HCV protein interactions. 293T and Huh7.5 cells were transfected with (A) CFP-E2 and YFP-E1, (B) CFP-Core and YFP-Core, or (C) CFP-E2 and YFP-NS3. Panel 1 shows the subcellular distribution of the respective YFP (green) and CFP (red) fusions, as well as areas of co-localization (yellow) in 293T cells. The scale bar represents a length of 7 μm. Panel 2 depicts examples of primary FACS plots acquired for FRET analysis. Panel 3 shows the mean value of the percentage of cells scoring FRET+ (MF) and the according standard deviation across multiple independent transfections (n = 3 to 17).
Fig. 3.
Fig. 3.
Overview of HCV protein interactions measured via FACS-FRET in both tested cell lines. Statistical significant interactions with FRET values ≥ 10% are presented (compare to supplemental Fig. S1). Interactions in 293T are highlighted by dark green boxes, and those that were also significant in Huh7.5 are colored in fading green. Furthermore, we marked interactions that were previously described by others (black underscored bar; numbers of the corresponding references are written in the boxes). Interactions that were newly reported here are highlighted by a check mark (, , –, –, –83). The inlay depicts the correlation of FACS-FRET results generated for 293T and Huh7.5 liver cells. Mean values of the percentage of FRET+ cells derived from 293T transfection were plotted with the according values obtained from Huh7.5 transfections (n = 45; compare with supplemental Fig. S1). Pearson's correlation and the corresponding p value were calculated with Graph Pad Prism 5.0.
Fig. 4.
Fig. 4.
Novel HCV protein interactions detected via FACS-FRET. Panel 1 gives mean values of the percentage of FRET+ cells and standard deviations of multiple independent experiments (for the number of replicates (n), mean FRET values (MF), and standard deviations (S.D.), as well as statistical calculations, please refer to supplemental Fig. S1). We further present representative confocal images of 293T and Huh7.5 cells that were transfected with the indicated CFP (red) and YFP (green) fusion proteins in panel 2. Co-localization in the overlay appears yellow. The scale bar is 7 μm. A, CFP-E2 and YFP-p7, CFP-NS5B and YFP-E1, and CFP-NS5B and YFP-E2 showed significant FRET in both cell lines, whereas (B) CFP-E2 and YFP-Core, CFP-NS2 and YFP-Core, CFP-p7 and YFP-Core, and CFP-p7 and YFP-E1 only exerted FRET in 293T cells.
Fig. 5.
Fig. 5.
JFH1 p7-RR33/35QQ differentially interacts with Core, E1, and E2. A, primary FACS-FRET plots of 293T cells transfected with the indicated CFP and YFP fusion proteins. Please note that for p7 self-interaction we cotransfected either the p7-CFP and p7-YFP plasmid or the p7-RR/QQ-CFP together with the p7-RR/QQ-YFP. B, mean values of the percentage of FRET+ cells and standard deviations of seven independent transfections performed as indicated in A. For calculation of the statistical significance, mean FRET signals were compared with the two-tailed unpaired Student's t test (Graph Pad Prism 5.0).
Fig. 6.
Fig. 6.
Viral structural proteins co-immunoprecipitate with p7 in lysates of HCV expressing Huh7.5 cells. Huh7.5 cells were RNA electroporated with (1) no RNA, (2) HCV Jc1-E1(A4), or (3) HCV Jc1-E1(A4)-p7(HA), allowing detection of E1 by the A4 antibody (8) and p7 with an anti-HA antibody. Then p7(HA) was immunoprecipitated with a rabbit-derived anti-HA antibody (upper bands) or a mouse-derived anti-HA antibody (lower bands). Core, E1, E2, and p7 were detected in lysates and post-precipitation via immunoblotting.
Fig. 7.
Fig. 7.
Viral structural proteins co-localize with p7 in HCV expressing Huh7.5 cells. Huh7.5 cells were RNA electroporated with the indicated HCV constructs. Then immunofluorescence staining with specific antibodies was performed to detect areas of protein co-localization by means of confocal microscopy. We quantified co-localization using Costes Pearson's correlation (84). A, examples of confocal images. The squared Pearson's correlation coefficient (R2) is indicated in the merged image. The scale bar has a length of 5 μm. B, each dot represents the R2 correlation for one analyzed cell. Mean values of at least 12 measured cells per co-localization analysis were plotted and assessed for significant differences with one-way analysis of variance (Graph Pad Prism 5.0): p < 0.01 (*), p < 0.001 (**), and p < 0.0001 (***).
Fig. 8.
Fig. 8.
Viral structural proteins interact with p7 in HCV expressing intact Huh7.5 cells. Huh7.5 cells were RNA electroporated with the indicated HCV constructs. Then staining for proximity ligation assay (PLA) was done with the same antibodies that were used for co-localization analyses (compare with Fig. 7). We quantified positive PLA events through software-based counting of red dots and normalized the resulting value to the number of cells (nuclear DAPI staining). A, representative examples of PLA images. Indicated are the antibodies used for the primary PLA stain and the number of PLA dots identified by counting software. The scale bar has a length of 5 μm. B, each dot represents the number of PLA spots counted for one cell per image. Mean values of at least eight measurements per antibody pair were plotted and assessed for significant differences with one-way analysis of variance (Graph Pad Prism 5.0): p < 0.01 (*), p < 0.001 (**), and p < 0.0001 (***).
Fig. 9.
Fig. 9.
The HCV protein interaction network. HCV protein interactions measured in this study by FRET (red lines) or reported previously (dotted gray lines) were visualized as a network. Furthermore, HCV protein interactions with host cell factors were incorporated by using interaction data from the VirusMINT database and de Chassey et al. (4). This network was generated with Cytoscape (85).

Similar articles

Cited by

References

    1. Moradpour D., Penin F., Rice C. M. (2007) Replication of hepatitis C virus. Nat. Rev. Microbiol. 5, 453–463 - PubMed
    1. Kronenberger B., Zeuzem S. (2012) New developments in HCV therapy. J. Viral Hepatitis 19 Suppl 1, 48–51 - PubMed
    1. Tai A. W., Benita Y., Peng L. F., Kim S. S., Sakamoto N., Xavier R. J., Chung R. T. (2009) A functional genomic screen identifies cellular cofactors of hepatitis C virus replication. Cell Host Microbe 5, 298–307 - PMC - PubMed
    1. de Chassey B., Navratil V., Tafforeau L., Hiet M. S., Aublin-Gex A., Agaugue S., Meiffren G., Pradezynski F., Faria B. F., Chantier T., Le Breton M., Pellet J., Davoust N., Mangeot P. E., Chaboud A., Penin F., Jacob Y., Vidalain P. O., Vidal M., Andre P., Rabourdin-Combe C., Lotteau V. (2008) Hepatitis C virus infection protein network. Mol. Syst. Biol. 4, 230. - PMC - PubMed
    1. Li Q., Brass A. L., Ng A., Hu Z., Xavier R. J., Liang T. J., Elledge S. J. (2009) A genome-wide genetic screen for host factors required for hepatitis C virus propagation. Proc. Natl. Acad. Sci. U.S.A. 106, 16410–16415 - PMC - PubMed

Publication types

LinkOut - more resources