. 2014 Aug;92(7):591-604.
doi: 10.1038/icb.2014.37. Epub 2014 May 6.

Phorbol myristate acetate, but not CD40L, induces the differentiation of CLL B cells into Ab-secreting cells

Affiliations
Free PMC article

Phorbol myristate acetate, but not CD40L, induces the differentiation of CLL B cells into Ab-secreting cells

Hussein Ghamlouch et al. Immunol Cell Biol. 2014 Aug.
Free PMC article

Abstract

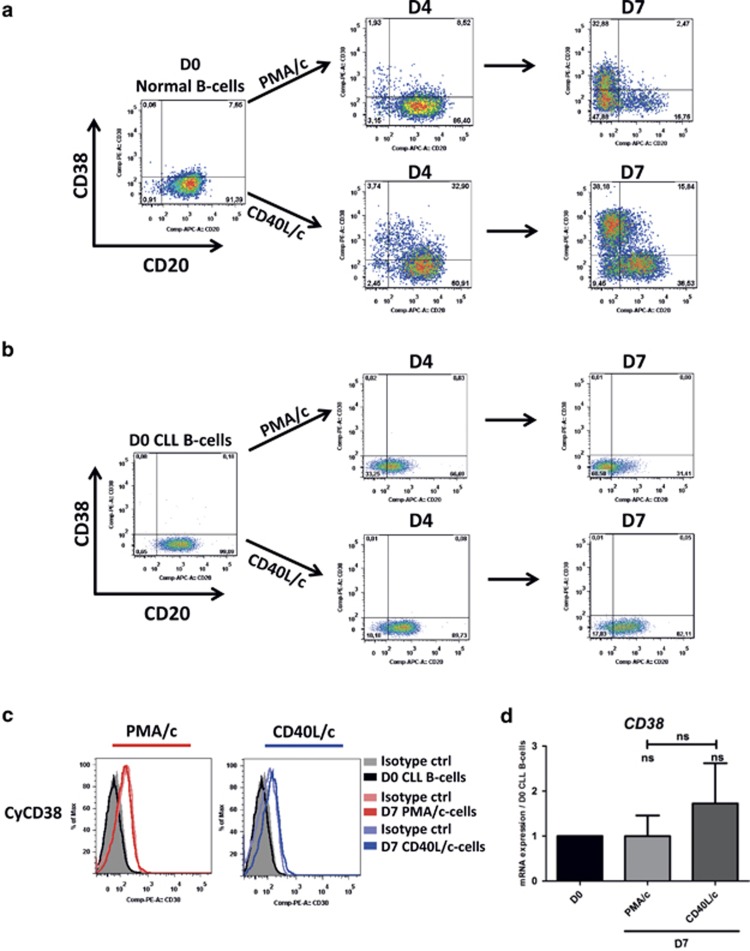
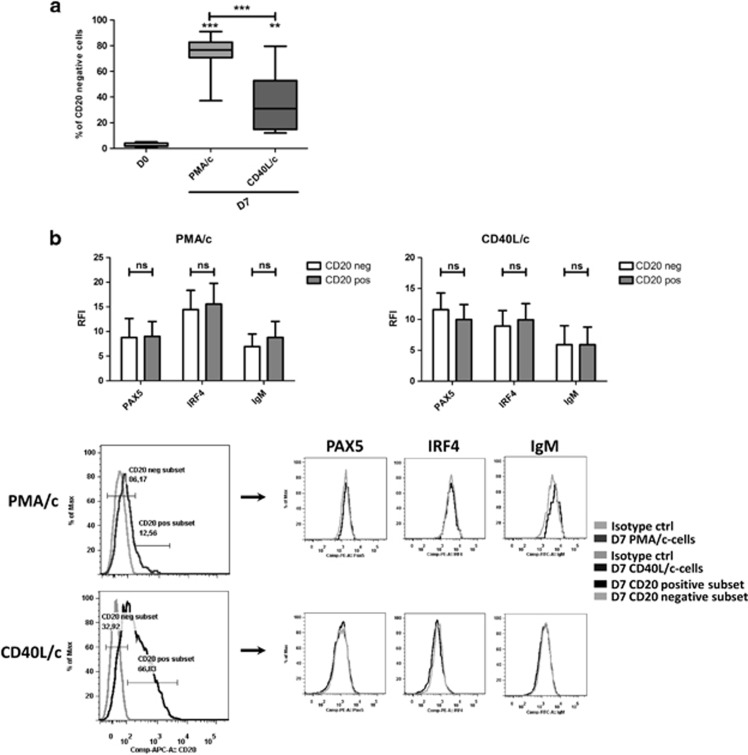
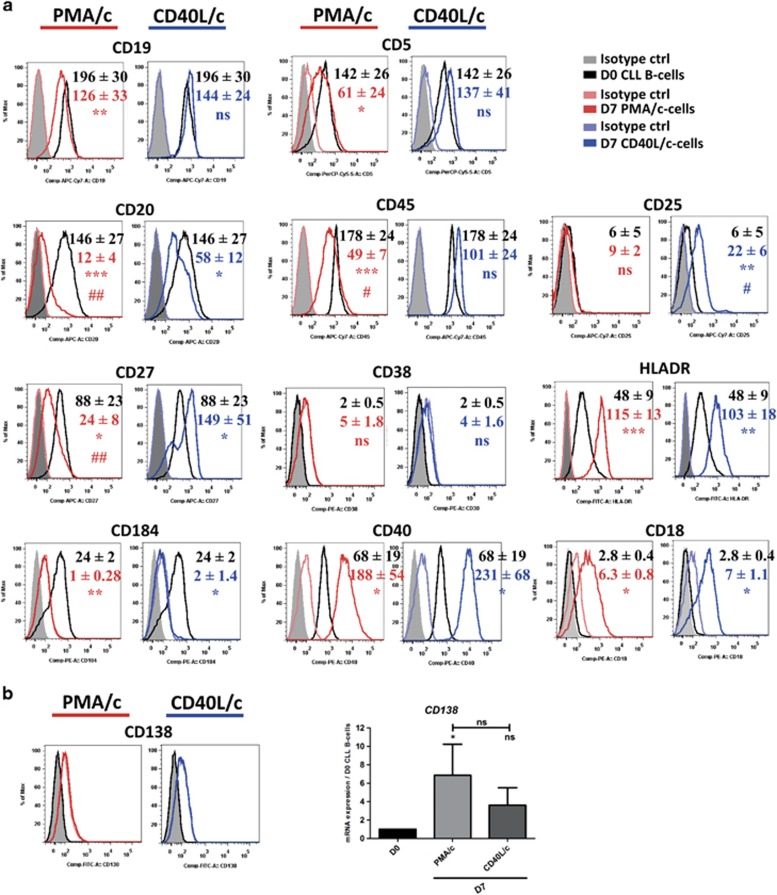
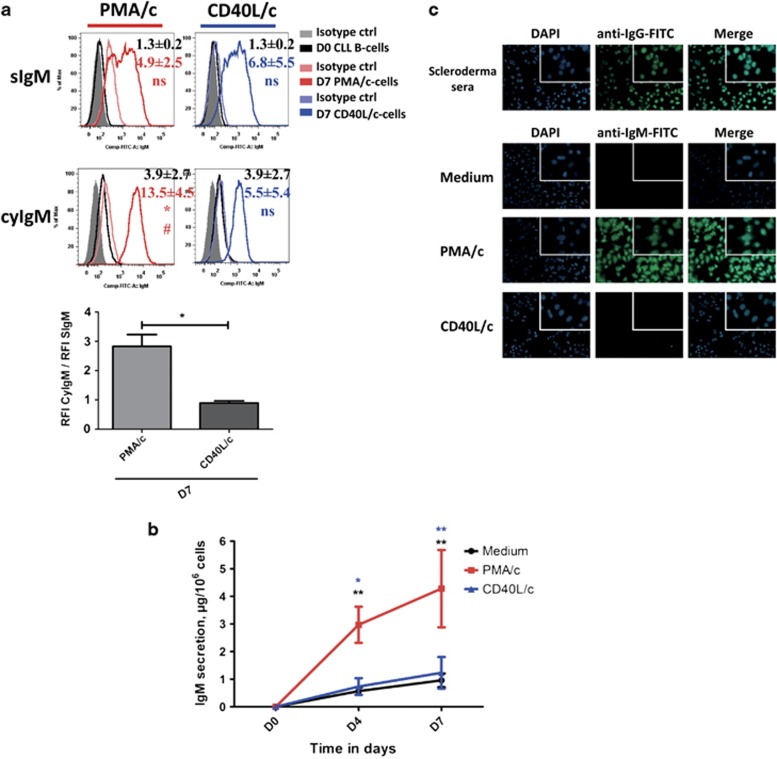
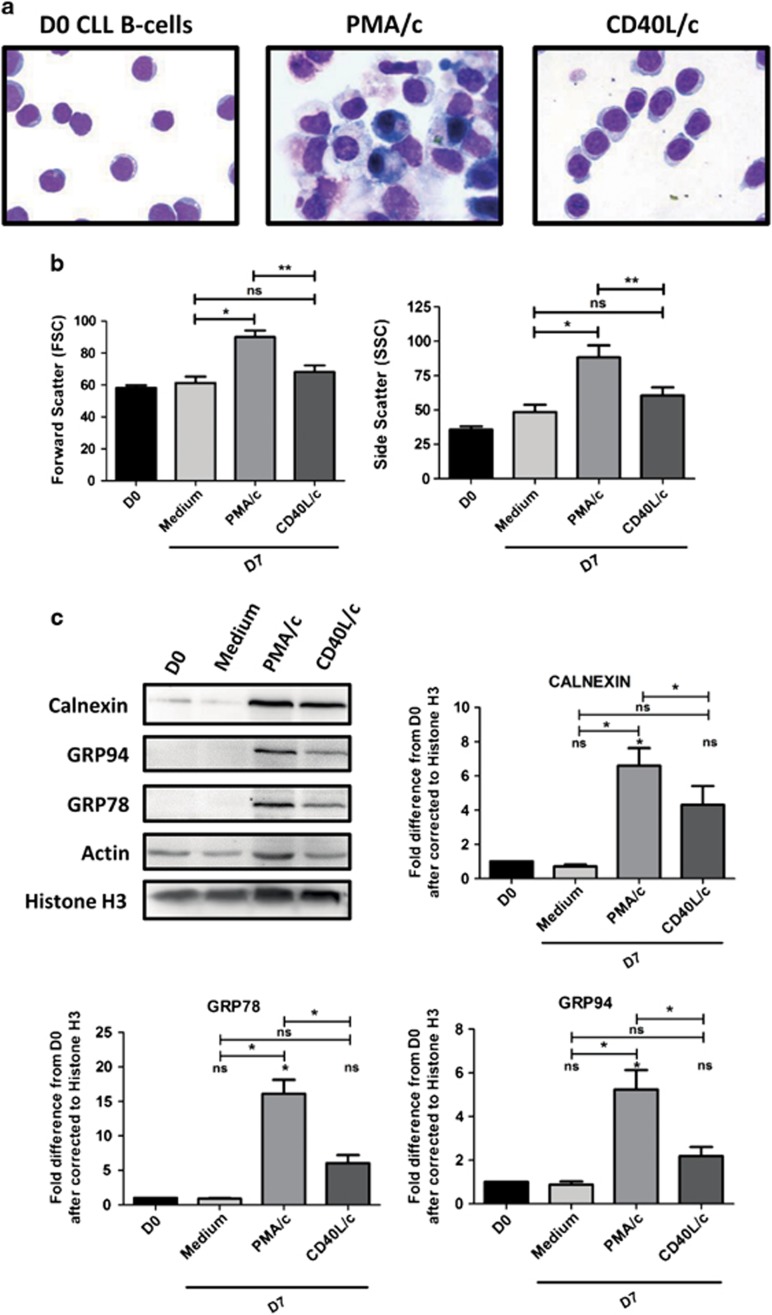
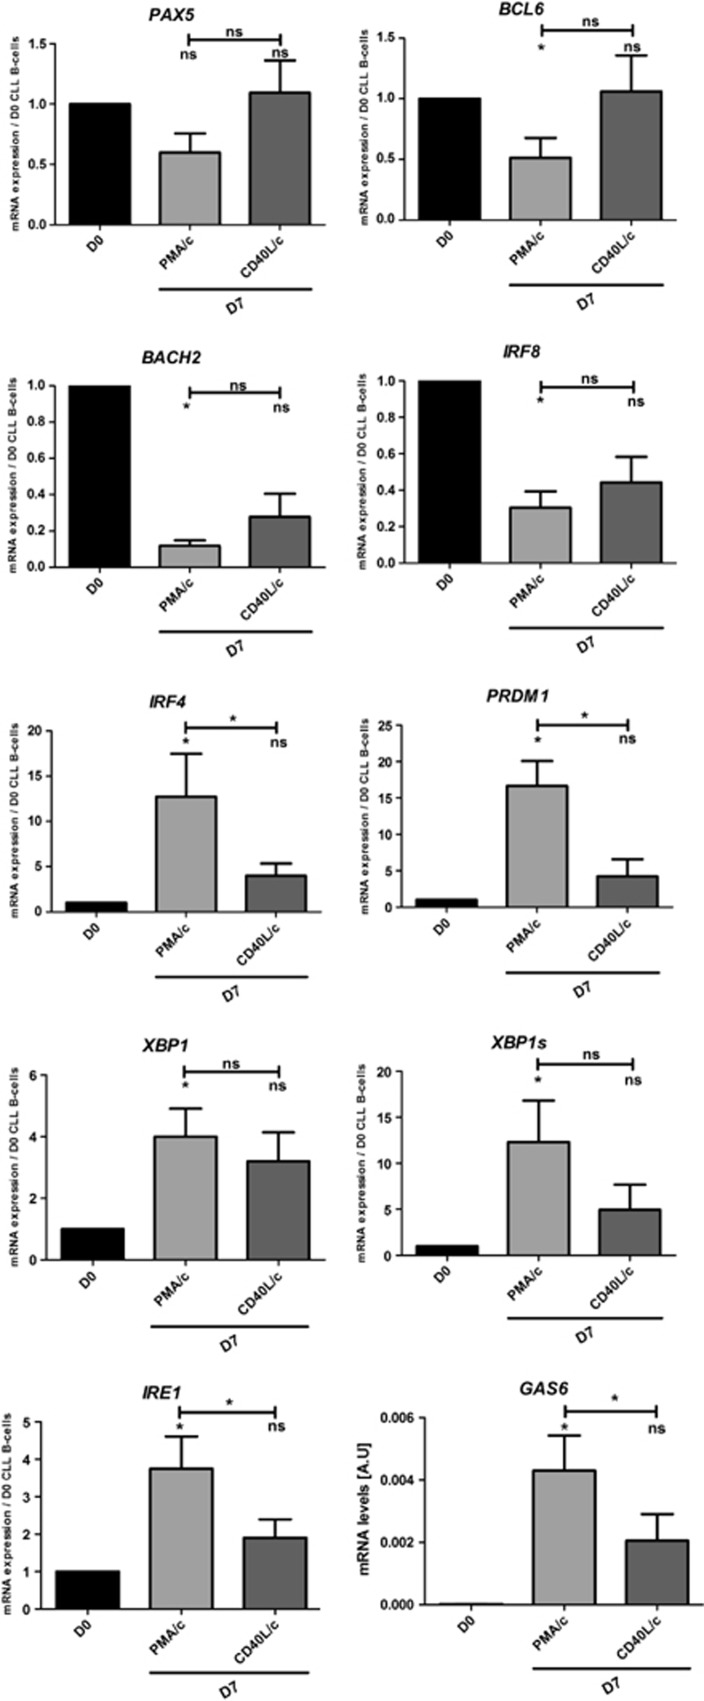
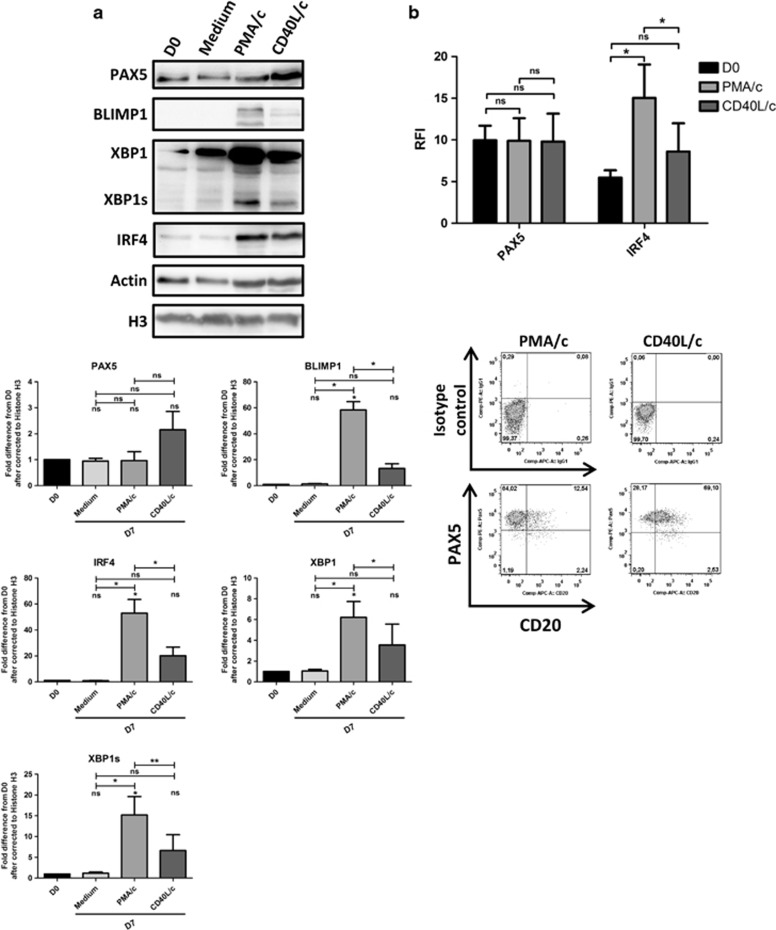
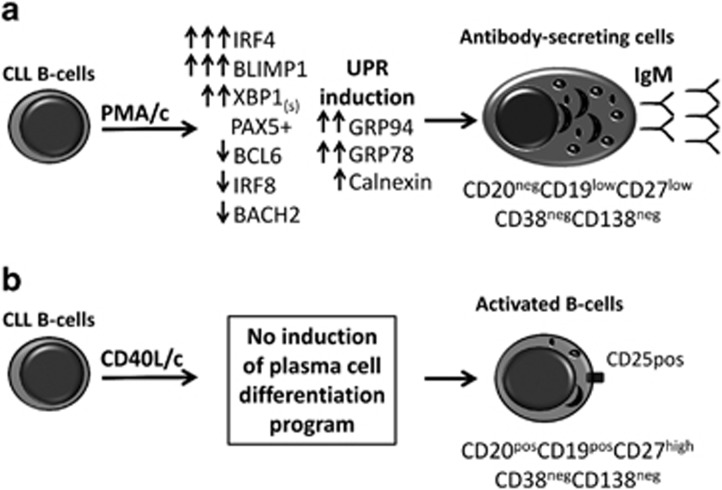
In this study, we investigated the capacity of chronic lymphocytic leukemia (CLL) B cells to undergo terminal differentiation into Ig-secreting plasma cells in T cell-independent and T cell-dependent responses. We used a two-step model involving stimulation with phorbol myristate acetate (PMA) and CD40L, together with cytokines (PMA/c and CD40L/c), for 7 days. We describe immunophenotypic modifications, changes in the levels of mRNA and protein for transcription factors and morphological and functional events occurring during the differentiation of CLL B cells into antibody-secreting cells (ASCs). The induction of differentiation differed significantly between the CD40L/c and PMA/c culture systems. The PMA/c culture system allowed CLL B cells to differentiate into IgM-secreting cells with an immunophenotype and molecular profile resembling those of preplasmablasts. By contrast, CD40L/c-stimulated cells had a phenotype and morphology similar to those of activated B cells and resembling those of the CLL B cells residing in the lymph node and bone marrow. These data suggest that the CLL B cells are not frozen permanently at a stage of differentiation and are able to differentiate into ASCs as appropriate stimulation are provided. The data presented here raise questions about the molecular processes and stimulation required for CLL B-cell differentiation and about the inability of CD40 ligand to induce differentiation of the CLL B cells.


Figures

Figure 1
Figure 1
CD20 and CD38 expression on normal and CLL B cells in the PMA/c and CD40L/c culture systems. Cells were stimulated with PMA or CD40L, in combination with the cytokines IL-2, IL-4, IL-10 and IL-12. On D4, cells were harvested and incubated with IL-2, IL-6, IL-10 and IL-12 for 3 days. (a, b) Cells were labeled with anti-CD20 and anti-CD38 mAbs to explore changes in the surface expression of these proteins between D0, D4 and D7 on normal (a) and CLL B cells (b). The cytometry plots are representative of two and twelve independent experiments for normal and CLL B cells, respectively. (c) Cells were labeled with anti-CD38 antibody after permeabilization. Cytometry plots for cytoplasmic CD38 are representative of twelve independent experiments. (d) The expression of the CD38 gene was evaluated by quantitative real-time RT-PCR on D0 CLL B cells and D7 stimulated cells. Results are expressed relative to gene expression in CLL B cells on D0, according to the 2−ΔΔCT method. Bars represent mean values±s.e.m. from five independent experiments. Statistical significance was calculated using the Wilcoxon test. ns, not significant. D, day. Cy, cytoplasmic.
Figure 2
Figure 2
CD20neg and CD20pos cells generated from CLL B cells in the PMA/c and CD40L/c culture system showed similar levels of expression of PAX5, IRF4 and IgM. (a) Percentages of CD20-negative cells on D7 in PMA/c and CD40L/c culture conditions. Data are represented as box and whisker (min to max) plots for 12 independent experiments. Statistical significance was calculated using the Wilcoxon test. (b) Cells were labeled with anti-PAX5, anti-IRF4 and anti-IgM Abs after permeabilization. Upper panel: Relative fluorescence intensities (RFIs were calculated as the ratio of the MFI of cells labeled with a specific Ab to that of cells labeled with a matched isotype control. Bars represent mean RFI values±s.e.m. for three independent experiments. Lower panel: Cytometry plots from a representative patient. Significance was calculated using the paired Student's t-test. **P<0.01, ***P<0.001. ns, not significant. D, day.
Figure 3
Figure 3
The immunophenotype of D7 cells. (A) On D0 and D7, cell immunophenotype was studied by direct labeling of CD19, CD20, CD27, CD184, CD5, CD45, CD38, CD40, CD25, HLA-DR, CD18 and CD138. (a) RFIs were calculated as the ratio of the MFI of cells labeled with a specific Ab to that of cells labeled with a matched isotype control. Mean RFI values±s.e.m. from eight independent experiments are represented with a color code: Black: D0, red: D7 PMA/c-stimulated cells, blue: D7 CD40L/-stimulated cells. Cytometry data are presented as plots for a representative patient. (b) Cytometry plot of CD138 expression for a representative patient. The expression of the CD138 gene was evaluated by quantitative real-time RT-PCR in D0 CLL B cells and D7 stimulated cells. Results are expressed relative to gene expression in CLL B cells on D0, according to the 2−ΔΔCT method. Bars represent mean values±s.e.m. from five independent experiments. Statistical significance was calculated using a the Wilcoxon test. *The D7 value is different from that in D0 CLL B cells. #The D7 value is different between PMA/c- and CD40L/-stimulated cells. *, #P<0.05, **, ##P<0.01, ***P<0.001. ns, not significant. D, day.
Figure 4
Figure 4
IgM expression and secretion by PMA/c- and CD40L/c-stimulated cells. (a) D0 CLL B cells and D7 PMA/c- and CD40L/c-stimulated cells were labeled before and after permeabilization with fluorescein isothiocyanate-conjugated anti–human IgM mAbs or isotype control mAbs. The cytometry plots are representative of three independent experiments. The bar histogram shows the ratio of RFI for cytoplasmic IgM to that for surface IgM. RFI was calculated as the ratio of the MFI of cells labeled with a specific Ab to that of cells labeled with a matched isotype control. Data are representative of three independent experiments. Significance was calculated using the paired Student's t-test. (b) Culture supernatants were harvested on D4 and D7. IgM secretion was assessed with an enzyme-linked immunosorbent assay. The results are expressed as the mean±s.e.m. (in μg per 106 cells) for five independent experiments. Significance was calculated using the Wilcoxon test: *P<0.05, **P<0.01. S, surface, Cy, cytoplasmic, D, day. (c) Indirect immunofluorescence analysis showed that the IgM secreted into the culture supernatant of PMA/c-stimulated cells recognized autoantigens in HEp-2 cells. Magnification: × 200. Magnification for insets: × 630.
Figure 5
Figure 5
Morphological analysis and UPR induction. (a) CLL B cells on D0 and stimulated cells on D7 were stained with May-Grünwald-Giemsa reagent. Original magnification: × 1000. (b) Cell size and granularity were measured by flow cytometry. Relative cell size was determined by assessing the light diffracted at small angles (detected as forward scatter ). Granularity is proportional to the light diffracted at large angles (detected as side scatter). Bars represent mean values±s.e.m. from twelve independent experiments. Significance was calculated using the Wilcoxon test. (c) Immunoblot analysis and densitometry quantification of calnexin, GRP94, GRP78, actin, histone H3 protein in D0 CLL B cells, D7 non-stimulated cells (Medium), D7 PMA/c-stimulated cells and D7 CD40L/c-stimulated cells. Data are shown as mean values±s.e.m. for three independent experiments. Statistical significance was calculated using the Student's t-test. *P<0.05, **P<0.01, ns, not significant, D, day.
Figure 6
Figure 6
Day 7 analysis of the mRNAs for transcription factors involved in B cell-to-plasma cell differentiation. (a) The expression of the PAX5, BCL6, BACH2, IRF8, IRF4, PRDM1, IRE1 and XBP1s genes was evaluated by quantitative real-time RT-PCR on D0 and D7. Results are expressed relative to gene expression in CLL B cells on D0, according to the 2−ΔΔCT method. Bars represent mean values±s.e.m. from five independent experiments. Statistical significance was calculated using the Wilcoxon test: *P<0.05. ns, not significant.
Figure 7
Figure 7
Day 7 proteomic analysis of transcription factors involved in B cell-to-plasma cell differentiation. (a) Immunoblot analysis and densitometry quantification of PAX5, IRF8, IRF4, XBP1, XBP1s and BLIMP1 in D0 CLL B cells, D7 non-stimulated cells (Medium), D7 PMA/c-stimulated cells and D7 CD40L/c-stimulated cells. The data shown are representative of three independent experiments. Statistical significance was calculated with using Student's t-test. (b) Cells were labeled with anti-PAX5 and anti-IRF4 Abs after permeabilization. Upper panel: relative fluorescence intensities (RFIs) were calculated as the ratio of the MFI of cells labeled with a specific Ab to that of cells labeled with a matched isotype control. Bars represent RFI mean values±s.e.m. from three independent experiments. Lower panel: cytometry plots for a representative patient. Significance was calculated using a paired Student's t-test. *P<0.05, **P<0.01. ns, not significant. D, day.
Figure 8
Figure 8
PMA, but not CD40L, triggers CLL B cells to differentiate into ASCs. (A) CLL B cells cultured in PMA/c system acquired the morphology of ASCs, as evidenced by an eccentrically placed nucleus and a well-developed cytoplasm due to an extensive ER and Golgi apparatus. ASCs/plasma cells are specialized cells capable of secreting large amounts of Ig, and therefore require a functional UPR. The UPR is induced when the endoplasmic reticulum is overloaded with unfolded proteins. Activation of the UPR leads to a decrease in the amount of new unfolded proteins and an enhanced production of chaperones (GRP78/Bip, GRP94 and Calnexin), which facilitate protein folding. These morphological and molecular modifications primed the CLL B cells to differentiate into IgM-secreting cells. These cells presented an immunophenotype (CD20negCD19lowCD27lowCD38negCD138neg) and transcription factor profile (co-expression of B cell (PAX5) and plasma cell transcription (BLIMP1 and XBP1)) of preplasmablast. (b) CD40L/c system fail to induce plasma cell differentiation program and CLL B cells were unable to differentiate into ASCs. However, generated cells had an activated B-cell morphology and phenotype (CD25+CD27+) and an increased expression of IRF4 resembling that of CLL B cells in the lymph nodes and bone marrow. The capacity of CLL B cells to differentiate into ASCs in PMA/c system and not in CD40L/c may result from the activation requirements and the intrinsic mechanism of CLL B-cells differentiation.

References

    1. Manz RA, Hauser AE, Hiepe F, Radbruch A. Maintenance of serum antibody levels. Annu Rev Immunol. 2005;23:367–386. - PubMed
    1. Goodnow CC, Vinuesa CG, Randall KL, Mackay F, Brink R. Control systems and decision making for antibody production. Nat Immunol. 2010;11:681–688. - PubMed
    1. Schmidlin H, Diehl SA, Blom B. New insights into the regulation of human B-cell differentiation. Trends Immunol. 2009;30:277–285. - PMC - PubMed
    1. Nera KP, Lassila O. Pax5—a critical inhibitor of plasma cell fate. Scand J Immunol. 2006;64:190–199. - PubMed
    1. Shaffer AL, Shapiro-Shelef M, Iwakoshi NN, Lee AH, Qian SB, Zhao H, et al. XBP1, downstream of Blimp-1, expands the secretory apparatus and other organelles, and increases protein synthesis in plasma cell differentiation. Immunity. 2004;21:81–93. - PubMed

Publication types

MeSH terms