

Using landscape and bioclimatic features to predict the distribution of lions, leopards and spotted hyaenas in Tanzania's Ruaha landscape
- PMID: 24797792
- PMCID: PMC4010451
- DOI: 10.1371/journal.pone.0096261
Using landscape and bioclimatic features to predict the distribution of lions, leopards and spotted hyaenas in Tanzania's Ruaha landscape
Abstract
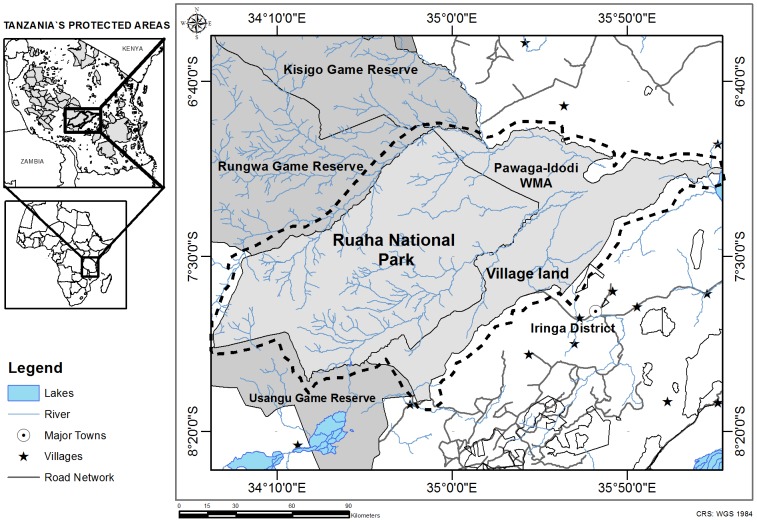
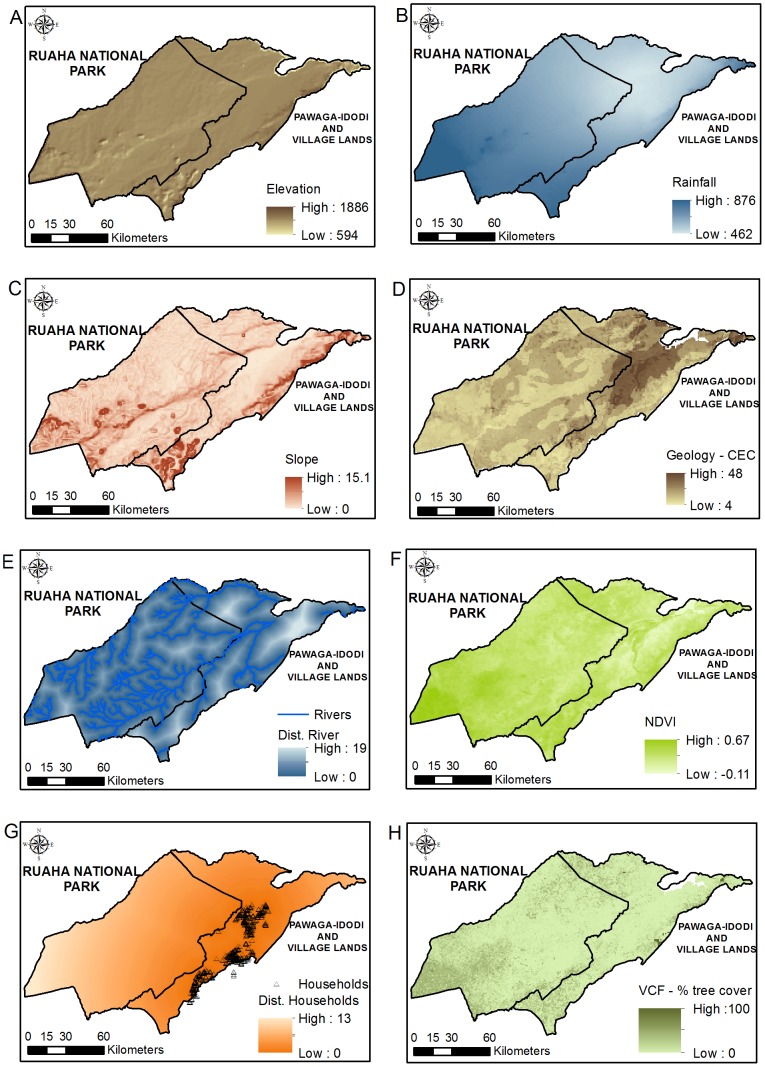
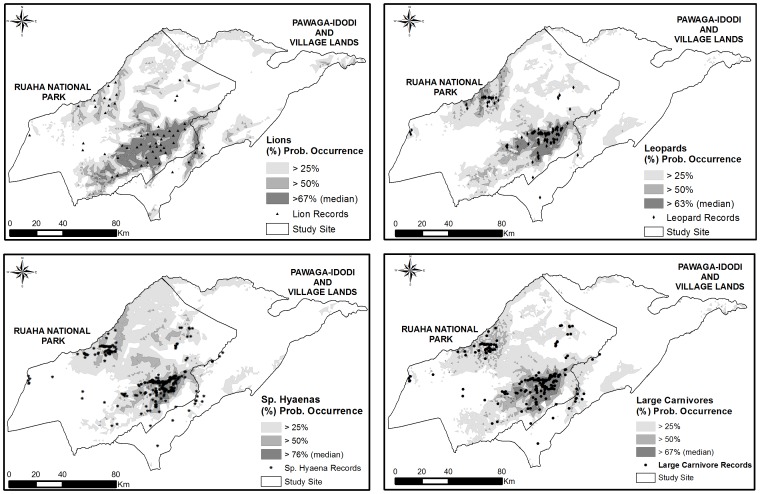
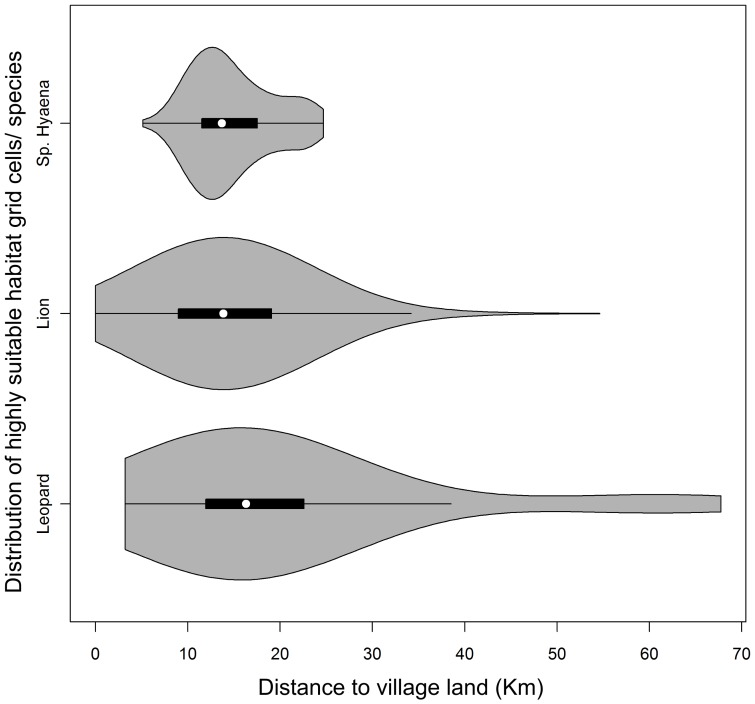
Tanzania's Ruaha landscape is an international priority area for large carnivores, supporting over 10% of the world's lions and important populations of leopards and spotted hyaenas. However, lack of ecological data on large carnivore distribution and habitat use hinders the development of effective carnivore conservation strategies in this critical landscape. Therefore, the study aimed to (i) identify the most significant ecogeographical variables influencing the potential distribution of lions, leopards and spotted hyaenas across the Ruaha landscape; (ii) identify zones with highest suitability for harbouring those species; and (iii) use species distribution modelling algorithms (SDMs) to define important areas for conservation of large carnivores. Habitat suitability was calculated based on environmental features from georeferenced presence-only carnivore location data. Potential distribution of large carnivores appeared to be strongly influenced by water availability; highly suitable areas were situated close to rivers and experienced above average annual precipitation. Net primary productivity and tree cover also exerted some influence on habitat suitability. All three species showed relatively narrow niche breadth and low tolerance to changes in habitat characteristics. From 21,050 km2 assessed, 8.1% (1,702 km2) emerged as highly suitable for all three large carnivores collectively. Of that area, 95.4% (1,624 km2) was located within 30 km of the Park-village border, raising concerns about human-carnivore conflict. This was of particular concern for spotted hyaenas, as they were located significantly closer to the Park boundary than lions and leopards. This study provides the first map of potential carnivore distribution across the globally important Ruaha landscape, and demonstrates that SDMs can be effective for understanding large carnivore habitat requirements in poorly sampled areas. This approach could have relevance for many other important wildlife areas that only have limited, haphazard presence-only data, but which urgently require strategic conservation planning.
Conflict of interest statement
Figures
References
-
- Pitman RT, Swanepoel LH, Ramsay PM (2012) Predictive modelling of leopard predation using contextual Global Positioning System cluster analysis. Journal of Zoology 288: 222–230.
-
- Ritchie EG, Johnson CN (2009) Predator interactions, mesopredator release and biodiversity conservation. Ecology Letters 12: 982–998. - PubMed
-
- Power ME, Tilman D, Estes JA, Menge BA, Bond WJ, et al. (1996) Challenges in the Quest for Keystones. BioScience 46: 609–620.
-
- Kunkel KE, Atwood TC, Ruth TK, Pletscher DH, Hornocker MG (2012) Assessing wolves and cougars as conservation surrogates. Animal Conservation.
Publication types
MeSH terms
LinkOut - more resources
Full Text Sources
Other Literature Sources
