. 2014 May 5;9(5):e96403.
doi: 10.1371/journal.pone.0096403. eCollection 2014.

Bead arrays for antibody and complement profiling reveal joint contribution of antibody isotypes to C3 deposition

Affiliations

Bead arrays for antibody and complement profiling reveal joint contribution of antibody isotypes to C3 deposition

Burcu Ayoglu et al. PLoS One. .

Abstract

The development of antigen arrays has provided researchers with great tools to identify reactivities against self or foreign antigens from body fluids. Yet, these approaches mostly do not address antibody isotypes and their effector functions even though these are key points for a more detailed understanding of disease processes. Here, we present a bead array-based assay for a multiplexed determination of antigen-specific antibody levels in parallel with their properties for complement activation. We measured the deposition of C3 fragments from serum samples to reflect the degree of complement activation via all three complement activation pathways. We utilized the assay on a bead array containing native and citrullinated peptide antigens to investigate the levels of IgG, IgM and IgA autoantibodies along with their complement activating properties in serum samples of 41 rheumatoid arthritis patients and 40 controls. Our analysis revealed significantly higher IgG reactivity against the citrullinated fibrinogen β and filaggrin peptides as well as an IgA reactivity that was exclusive for citrullinated fibrinogen β peptide and C3 deposition in rheumatoid arthritis patients. In addition, we characterized the humoral immune response against the viral EBNA-1 antigen to demonstrate the applicability of this assay beyond autoimmune conditions. We observed that particular buffer compositions were demanded for separate measurement of antibody reactivity and complement activation, as detection of antigen-antibody complexes appeared to be masked due to C3 deposition. We also found that rheumatoid factors of IgM isotype altered C3 deposition and introduced false-positive reactivities against EBNA-1 antigen. In conclusion, the presented bead-based assay setup can be utilized to profile antibody reactivities and immune-complex induced complement activation in a high-throughput manner and could facilitate the understanding and diagnosis of several diseases where complement activation plays role in the pathomechanism.


Conflict of interest statement

Competing Interests: J.P. is a paid employee of Diagnosticum Ltd. This does not alter the authors' adherence to PLOS ONE policies on sharing data and materials.

Figures

Figure 1
Figure 1. Schematic representation of assay workflow.
A) Serum samples are diluted 1∶10, either in a Ca2+-Mg2+ containing assay buffer for detection of complement activation, or in an EDTA containing assay buffer for antibody detection. B) The samples are pre-adsorbed against neutravidin-specific antibodies. C) A mixture of beads coupled to various antigens is distributed into a 384-well plate and the pre-adsorbed samples are added to the bead array. D) Complement activation driven C3 deposition and different antibody isotypes are detected in parallel with fluorescently labeled secondary antibodies dispensed into individual wells of each quadrant of the 384-well plate.
Figure 2
Figure 2. Dependence of complement activation on serum dilution rate.
For measuring the background, classical, lectin & alternative and only alternative pathway activation, a serially diluted serum sample (1∶1–1∶160) was applied to empty, human IgG, human IgA and properdin-coupled beads, respectively. The assay buffer for serum dilution contained either Ca2+-Mg2+, which promotes complement activation, or EDTA, which blocks complement activation. Complement activation-driven C3 fragment deposition on beads was detected by PE-conjugated anti-human C3 antibody. Plots display for each serum dilution the respective median fluorescence intensity (MFI) value against varying concentrations of human IgG, human IgA and properdin coupled on beads. AU - arbitrary units
Figure 3
Figure 3. Complement activation masks detectability of antibodies.
Human IgG ( A,D ), human IgM ( B ) and EBNA-1 ( C ) coupled beads were incubated in 1∶10 diluted serum. Ca2+- Mg2+ (-•-) or EDTA (-*-) supplemented assay buffer was used for serum dilution. Anti-human C3-PE (black lines and axes), anti-human IgG-PE (gray lines and axes) or anti-human IgM-PE (gray lines and axes) secondary antibodies were used to measure the complement activation, IgG or IgM levels, respectively.
Figure 4
Figure 4. Complement activation by rheumatoid factors.
Following incubation of human-IgG coupled beads in sera of RA patients or non-diseased controls, bound IgG-specific rheumatoid factors and deposited C3 fragments were detected. A ) Median fluorescence intensities (MFI) for anti-IgG, anti-IgM, anti-IgA and anti-C3 secondary antibodies are plotted separately for the RA patients and controls. Statistical differences between these two groups were calculated by Mann-Whitney non-parametric test. B ) Anti-IgA, anti-IgM and anti-C3 MFI values for the human-IgG coupled bead within RA patient group (Δ) and controls (▪) are plotted in a 3D graph for visualization of their correlation to each other. Anti-IgG MFI values are excluded from this plot since they not reveal a significant difference between the two groups. C) The table shows the Spearman's Rho correlation coefficients between anti-C3, anti-IgG, anti-IgM and anti-IgA MFI values in the entire sample cohort, where only statistically significant (p-value < 0.05) correlation coefficients are shown and non-significant correlations are indicated by (n.s.).
Figure 5
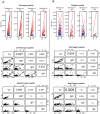
Figure 5. Detection of the level and the complement activating properties of autoantibodies against citrullinated peptides.
The arginine or citrulline-containing form of fibrinogen β chain peptide (SGSG60RPAPPPISGGGYRAR74 vs. SGSG60XPAPPPISGGGYXAX74) (A) and filaggrin peptides (454TRGRS458K vs. 454TXGRS458K) (B) were coupled on beads and incubated with serum samples to detect peptide-specific IgG, IgM, IgA autoantibody levels and their complement activating properties. Median fluorescent intensity (MFI) values for arginine or citrulline-containing forms of the peptides in RA patient group (red lines) or the control group (blue lines) are shown in the upper panel. Significance level of differences between controls and RA patients were calculated only for the citrullinated peptides by Mann-Whitney test and the p-values are indicated in the upper panel as follow: * p-value<0.05; ** p-value<0.01, ***p-value<0.001. Spearman's Rho correlation coefficients calculated between anti-C3, anti-IgG, anti-IgM and anti-IgA MFI values are shown for citrullined (middle panels) or native (lower panels) form of the peptides, where non-significant correlations are indicated by (n.s.).
Figure 6
Figure 6. Level of EBNA-1 specific antibodies and their complement activation.
EBNA-1 coupled beads were incubated with sera of RA patients and controls. A ) Levels of bound human IgG, IgM and IgA antibodies along with the degree of complement activation are plotted for the two groups. Mann-Whitney non-parametric statistical test was used to calculate the statistical difference between the two groups. B ) Signal intensities for anti-IgM, anti-IgA and anti-C3 for the controls (upper panel) and RA patients (lower panel) are plotted in a 3D graph. The tables show the Spearman's Rho correlation coefficients between anti-C3, anti-IgG, anti-IgM and anti-IgA signal intensities calculated separately for the control and RA patient groups. Only statistically significant (p-value<0.05) correlation coefficients are shown and non-significant correlations are indicated by (n.s.).

References

    1. Price JV, Haddon DJ, Kemmer D, Delepine G, Mandelbaum G, et al. (2013) Protein microarray analysis reveals BAFF-binding autoantibodies in systemic lupus erythematosus. J Clin Invest 123: 5135–5145. - PMC - PubMed
    1. Ayoglu B, Haggmark A, Khademi M, Olsson T, Uhlen M, et al. (2013) Autoantibody profiling in multiple sclerosis using arrays of human protein fragments. Mol Cell Proteomics 12: 2657–2672. - PMC - PubMed
    1. Miersch S, Bian X, Wallstrom G, Sibani S, Logvinenko T, et al. (2013) Serological autoantibody profiling of type 1 diabetes by protein arrays. J Proteomics 94: 486–496. - PubMed
    1. Prechl J, Papp K, Erdei A (2010) Antigen microarrays: descriptive chemistry or functional immunomics? Trends Immunol 31: 133–137. - PubMed
    1. Dunkelberger JR, Song WC (2010) Complement and its role in innate and adaptive immune responses. Cell Res 20: 34–50. - PubMed

Publication types

LinkOut - more resources