. 2014 May 5;9(5):e96427.
doi: 10.1371/journal.pone.0096427. eCollection 2014.

Reciprocal regulation of reactive oxygen species and phospho-CREB regulates voltage gated calcium channel expression during Mycobacterium tuberculosis infection

Affiliations

Reciprocal regulation of reactive oxygen species and phospho-CREB regulates voltage gated calcium channel expression during Mycobacterium tuberculosis infection

Arti Selvakumar et al. PLoS One. .

Abstract

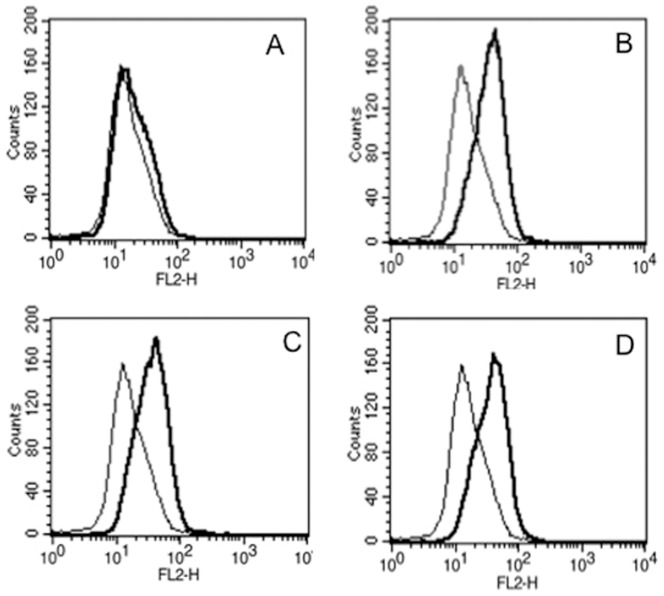
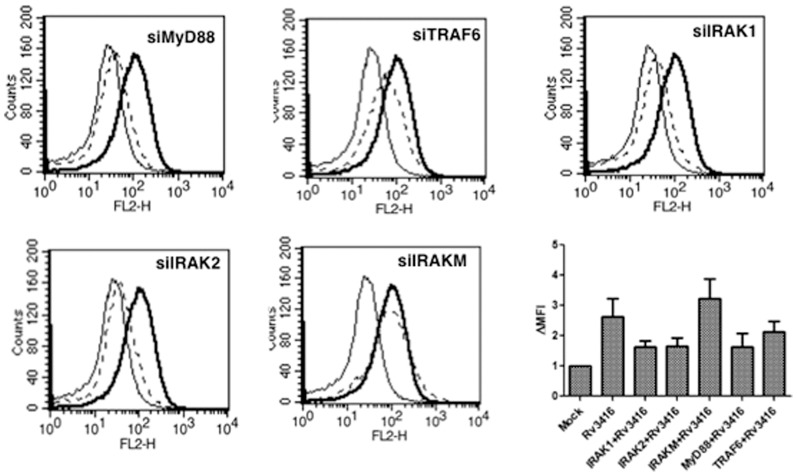
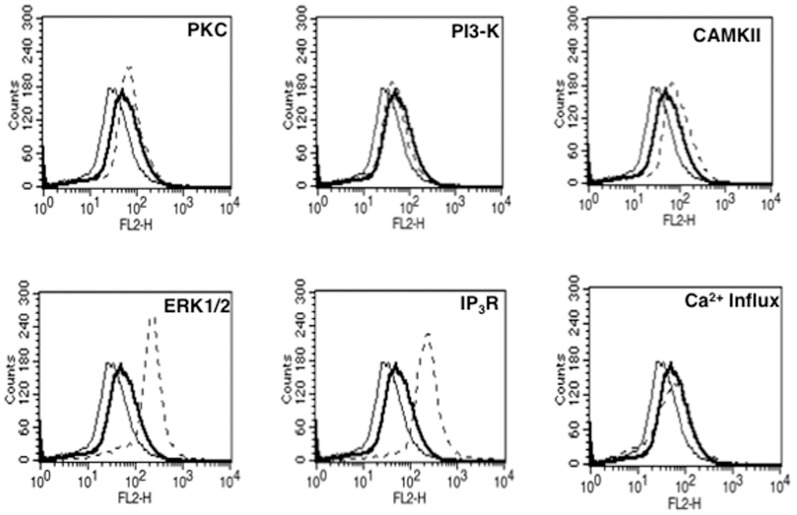
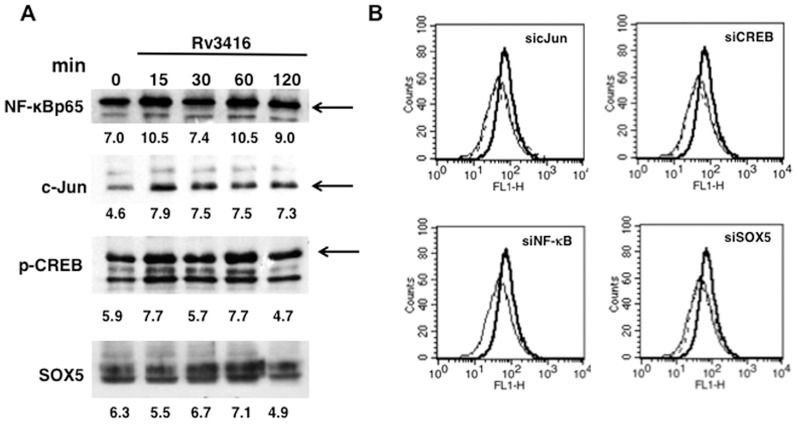
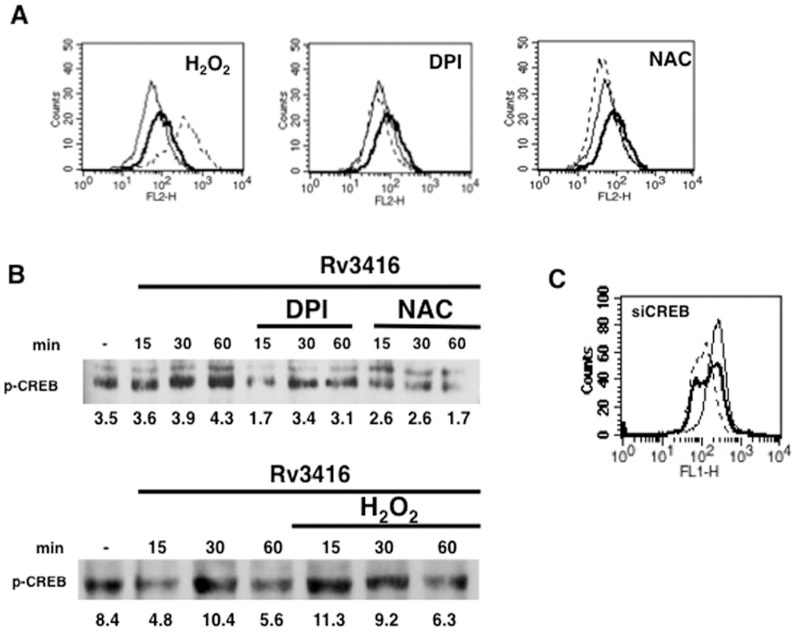
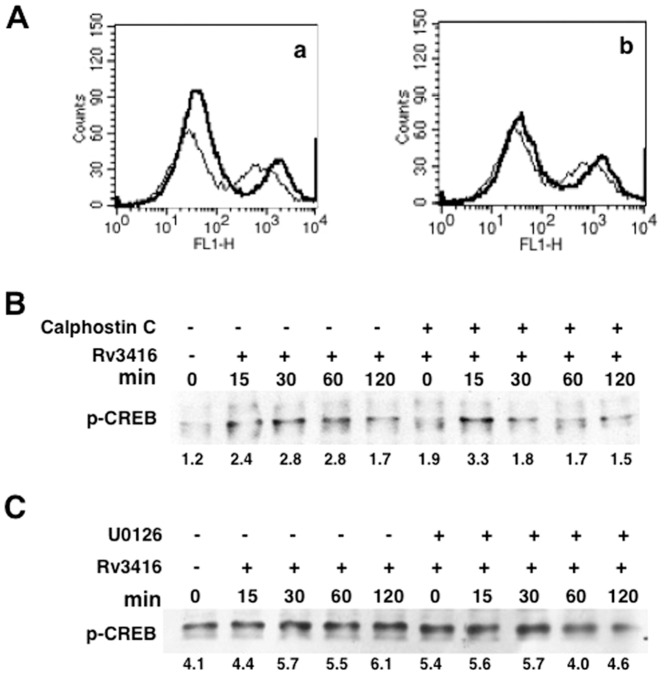
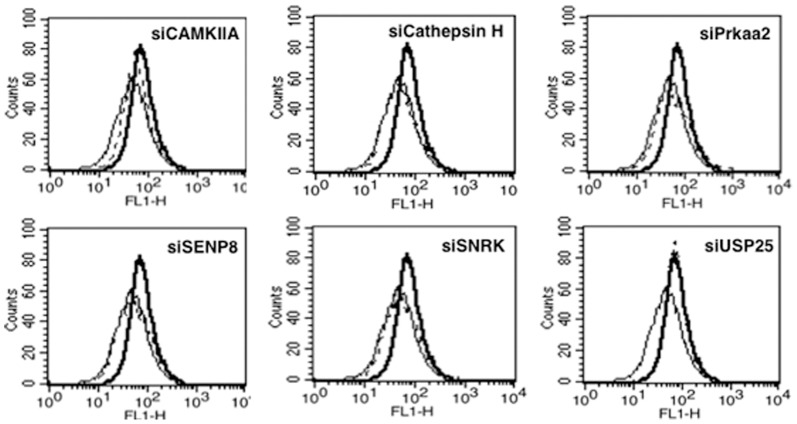
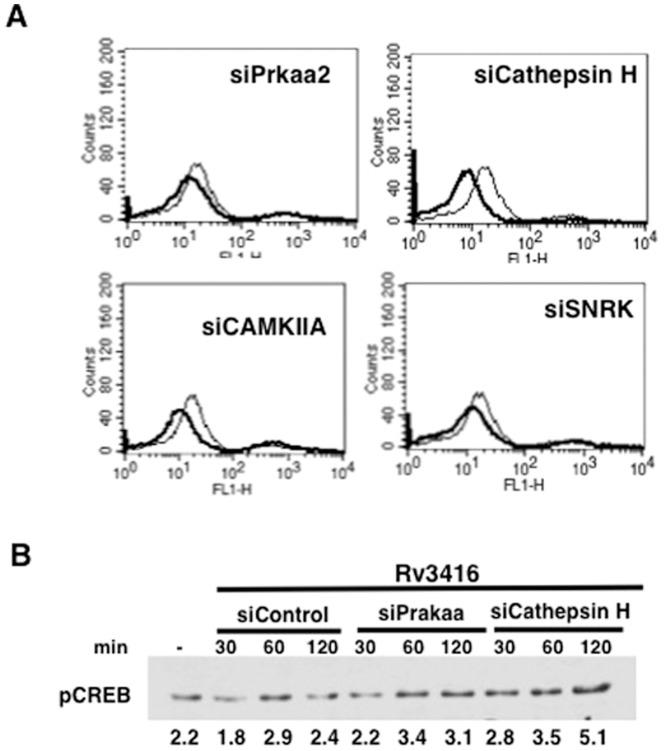
Our previous work has demonstrated the roles played by L-type Voltage Gated Calcium Channels (VGCC) in regulating Mycobacterium tuberculosis (M. tb) survival and pathogenesis. Here we decipher mechanisms and pathways engaged by the pathogen to regulate VGCC expression in macrophages. We show that M. tb and its antigen Rv3416 use phospho-CREB (pCREB), Reactive Oxygen Species (ROS), Protein Kinase C (PKC) and Mitogen Activated Protein Kinase (MAPK) to modulate VGCC expression in macrophages. siRNA mediated knockdown of MyD88, IRAK1, IRAK2 or TRAF6 significantly inhibited antigen mediated VGCC expression. Inhibiting Protein Kinase C (PKC) or MEK-ERK1/2 further increased VGCC expression. Interestingly, inhibiting intracellular calcium release upregulated antigen mediated VGCC expression, while inhibiting extracellular calcium influx had no significant effect. siRNA mediated knockdown of transcription factors c-Jun, SOX5 and CREB significantly inhibited Rv3416 mediated VGCC expression. A dynamic reciprocal cross-regulation between ROS and pCREB was observed that in turn governed VGCC expression with ROS playing a limiting role in the process. Further dissection of the mechanisms such as the interplay between ROS and pCREB would improve our understanding of the regulation of VGCC expression during M. tb infection.


Conflict of interest statement

Competing Interests: The authors have declared that no competing interests exist.

Figures

Figure 1
Figure 1. Rv3416 induces the upregulation of L-type VGCC on macrophages.
THP1 cells were stimulated overnight with 50/ml PMA followed by Rv3416 stimulation for 72h. L-type VGCC expression was monitored by flow cytometry. Bold lines represent stimulations with Rv3416 while thin lines represent unstimulated controls. Panels A-D represent stimulation with 15 µg/ml, 30 µg/ml, 45 µg/ml and 60 µg/ml of Rv3416, respectively. Data from one of four independent experiments are shown.
Figure 2
Figure 2. Rv3416 upregulates VGCC in a TLR dependent pathway.
PMA stimulated THP1 cells were transfected with siRNA against MyD88, TRAF6, IRAK1, IRAK2 or IRAKM for 36h, followed by stimulation with 30 µg/ml of Rv3416 for 72h. L-type VGCC levels were monitored using flow cytometry. Bold lines represent cells transfected with control siRNA followed by stimulations with Rv3416, while dotted lines represent cells transfected with specific siRNA to indicated molecules followed by stimulations with Rv3416. Thin lines represent unstimulated cells transfected with control siRNA. One of three independent experiments is shown. Bar chart shows the Fold increase in Mean Fluorescence Intensity (ΔMFI) in different groups over and above unstimulated control (represented as MOCK). Bars represent mean ± S.D. of three independent experiments.
Figure 3
Figure 3. PKC, ERK/MAPK, CAMKII and intracellular calcium release negatively regulate Rv3416 mediated VGCC expression.
PMA stimulated THP1 cells were incubated with inhibitors to indicated molecules (see Experimental Procedures) for 1h prior to stimulation with Rv3416. L-type VGCC levels were monitored by FACS 72h post stimulation. Bold lines represent cells stimulated with 30 µg/ml of Rv3416, while dotted lines represent cells incubated with inhibitors to indicated molecules followed by stimulations with Rv3416. Thin lines represent unstimulated cells. One of four independent experiments is shown.
Figure 4
Figure 4. CREB, c-Jun and SOX5 positively regulate Rv3416 mediated VGCC expression on macrophages.
For Panel A, PMA stimulated THP1 cells were stimulated with 30 µg/ml of Rv3416 for indicated times and the levels of indicated transcription factors were monitored in nuclear extracts by western blots. Numbers below the blots indicate relative intensities of the bands. Arrow indicates the specific band based on molecular weight markers. Data from one of two experiments are shown. For Panel B, PMA stimulated THP1 cells were transfected with siRNA against c-Jun (sicJun), CREB (siCREB), NF-KBp65 (siNF-κB) and SOX5 (siSOX5) for 36h, followed by stimulation with 30 µg/ml of Rv3416 for 72h. VGCC levels were monitored using flow cytometry. Bold lines represent cells transfected with control siRNA followed by stimulations with Rv3416, while dotted lines represent cells transfected with specific siRNA to indicated transcription factors followed by stimulations with Rv3416. Thin lines represent unstimulated cells transfected with control siRNA. One of two independent experiments is shown.
Figure 5
Figure 5. Reciprocal regulation between ROS and pCREB regulates VGCC expression.
For Panel A, PMA stimulated THP1 cells were incubated with indicated regents (see Experimental Procedures) for 1h followed by stimulation with 30 µg/ml of Rv3416. L-type VGCC levels were monitored after 72h by FACS. Bold lines represent cells stimulated with Rv3416, while dotted lines represent cells incubated with indicated reagents followed by stimulations with Rv3416. Thin lines represent unstimulated cells. For Panel B, PMA stimulated THP1 cells were stimulated with 30 µg/ml of Rv3416 with or without indicated reagents for indicated times and the nuclear levels of pCREB were monitored by western blot. Numbers below the blots indicate relative intensities of the bands. Panel C shows ROS levels in PMA stimulated THP1 cells transfected with siRNA to CREB (siCREB) followed by stimulation with Rv3416 for 2h. Bold lines represent cells transfected with control siRNA followed by stimulation with Rv3416, while dotted lines represent cells transfected with siRNA to CREB (siCREB) followed by stimulations with Rv3416. Thin lines represent unstimulated cells transfected with control siRNA. Data from one of three experiments are shown.
Figure 6
Figure 6. Inhibition of PKC or MAK-ERK enhances ROS generation in Rv3416 stimulated cells.
For Panel A, PMA stimulated THP1 cells were incubated with an inhibitor to PKC (subpanel a) or MAPK-ERK (subpanel b) for 1h prior to stimulation with 30 µg/ml of Rv3416 for 2h and ROS levels were monitored by flow cytometry. Thin line represents unstimulated control while bold lines represent Rv3416 stimulated cells. For Panel B and C, PMA stimulated THP1 cells were incubated with inhibitor to PKC (Calphostin C, Panel B) or MAPK-ERK (U0126, Panel C) and stimulated with Rv3416 for indicated times. Nuclear extracts were probed for pCREB levels. Numbers below the blots indicate relative intensities of the bands. Data from one of three experiments is shown.
Figure 7
Figure 7. Specific genes in the calcium-calmodulin and cysteine protease pathways differentially regulate Rv3416 mediated VGCC expression.
PMA stimulated THP1 cells were transfected with siRNA against CAMKIIA, Cathepsin H, Prkaa2, SENP8, SNRK or USP25 for 36h, followed by stimulation with 30 µg/ml of Rv3416 for 72h. VGCC levels were monitored using flow cytometry. Bold lines represent cells transfected with control siRNA followed by stimulations with Rv3416, while dotted lines represent cells transfected with specific siRNA to indicated molecules followed by stimulations with Rv3416. Thin lines represent unstimulated cells transfected with control siRNA. One of three independent experiments is shown.
Figure 8
Figure 8. Genes in the calcium/calmodulin and cysteine protease pathways positively regulate ROS levels.
For Panel A, PMA stimulated THP1 cells were transfected with siRNA against indicated genes and ROS levels were monitored by FACS 2h post stimulation with Rv3416. Bold lines represent cells transfected with siRNA against indicated genes while thin lines represent unstimulated cells transfected with control siRNA. Panel B shows pCREB levels in nuclear extracts of PMA stimulated THP1 cells transfected with siRNA against indicated genes followed by stimulation with Rv3416 for indicated times. One of two independent experiments is shown.

Similar articles

Cited by

References

    1. World Health Organization (2012) Global tuberculosis control 2012. Available: www.who.org.
    1. Koul A, Herget T, Klebl B, Ullrich A (2004) Interplay between Mycobacteria and host signaling pathways. . Nat. Rev. Microbiol. 2: 189–202. - PubMed
    1. Cantrell D (1996) T cell antigen receptor signal pathways. . Ann. Rev Immunol.14: 259–274. - PubMed
    1. Berridge MJ (1993) Cell signaling. A tale of two messengers. Nature 365: 388–389. - PubMed
    1. Lewis RS (2007) The molecular choreography of a store-operated calcium channel. Nature 446: 284–287. - PubMed

Publication types

MeSH terms

Substances

LinkOut - more resources