. 2014 Jul;58(7):4094-102.
doi: 10.1128/AAC.02664-14. Epub 2014 May 5.

Individualization of piperacillin dosing for critically ill patients: dosing software to optimize antimicrobial therapy

Affiliations

Individualization of piperacillin dosing for critically ill patients: dosing software to optimize antimicrobial therapy

T W Felton et al. Antimicrob Agents Chemother. 2014 Jul.

Abstract

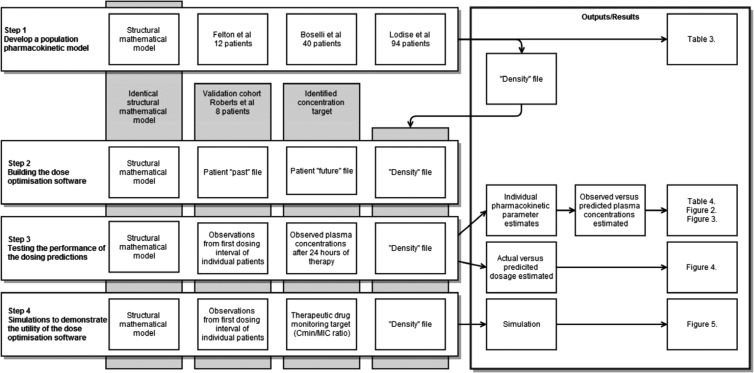
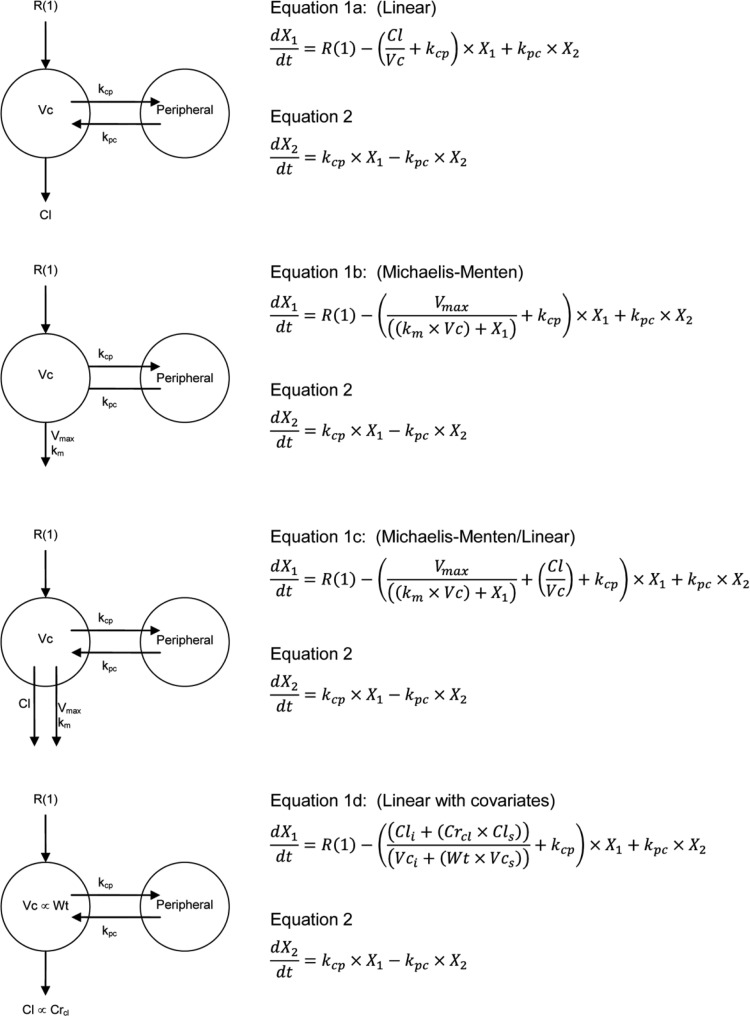
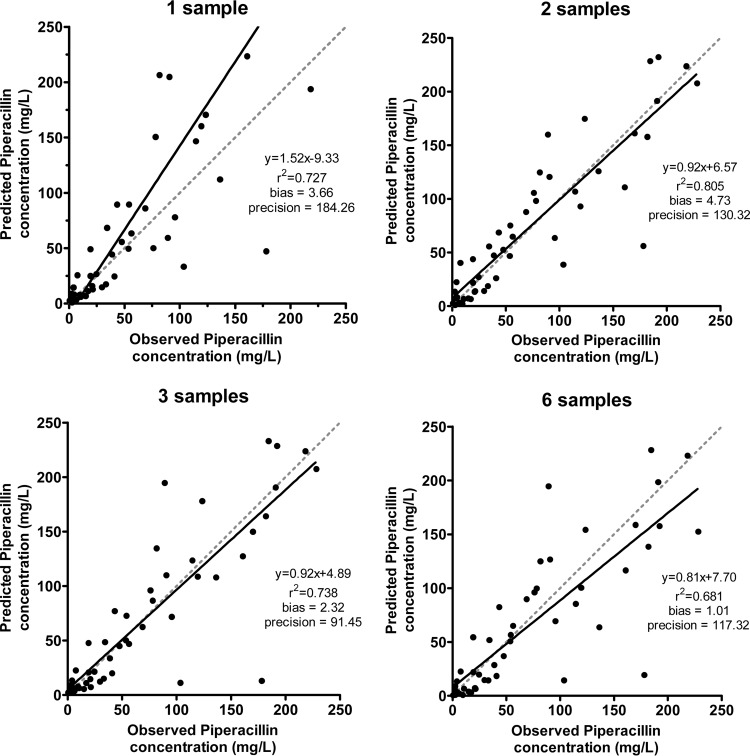
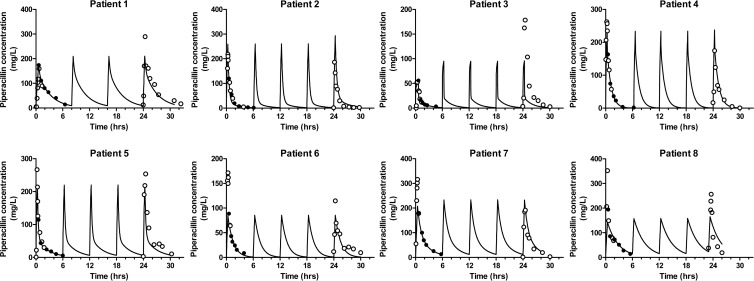
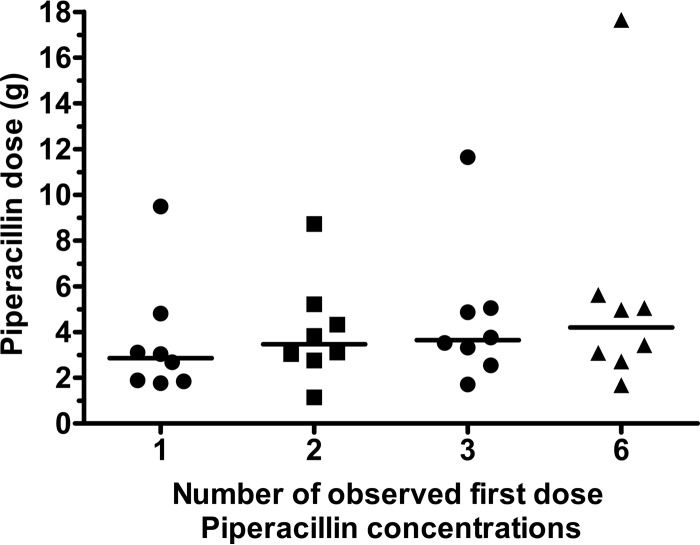
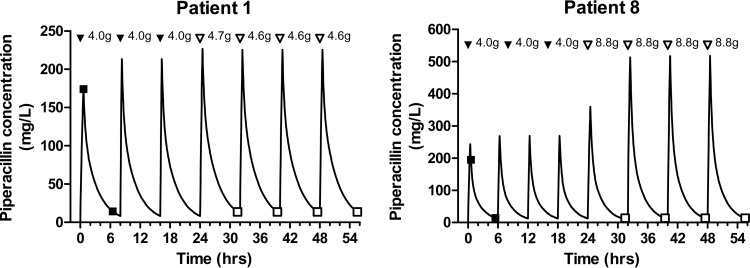
Piperacillin-tazobactam is frequently used for empirical and targeted therapy of infections in critically ill patients. Considerable pharmacokinetic (PK) variability is observed in critically ill patients. By estimating an individual's PK, dosage optimization Bayesian estimation techniques can be used to calculate the appropriate piperacillin regimen to achieve desired drug exposure targets. The aim of this study was to establish a population PK model for piperacillin in critically ill patients and then analyze the performance of the model in the dose optimization software program BestDose. Linear, with estimated creatinine clearance and weight as covariates, Michaelis-Menten (MM) and parallel linear/MM structural models were fitted to the data from 146 critically ill patients with nosocomial infection. Piperacillin concentrations measured in the first dosing interval, from each of 8 additional individuals, combined with the population model were embedded into the dose optimization software. The impact of the number of observations was assessed. Precision was assessed by (i) the predicted piperacillin dosage and by (ii) linear regression of the observed-versus-predicted piperacillin concentrations from the second 24 h of treatment. We found that a linear clearance model with creatinine clearance and weight as covariates for drug clearance and volume of distribution, respectively, best described the observed data. When there were at least two observed piperacillin concentrations, the dose optimization software predicted a mean piperacillin dosage of 4.02 g in the 8 patients administered piperacillin doses of 4.00 g. Linear regression of the observed-versus-predicted piperacillin concentrations for 8 individuals after 24 h of piperacillin dosing demonstrated an r(2) of >0.89. In conclusion, for most critically ill patients, individualized piperacillin regimens delivering a target serum piperacillin concentration is achievable. Further validation of the dosage optimization software in a clinical trial is required.


Figures

FIG 1
FIG 1
Overview of the development of the population pharmacokinetic model (step 1) and the building (step 2), testing (step 3), and demonstration (step 4) of the dosage optimization software. Pharmacokinetic data from 146 patients from three previous studies, Felton et al. (6), Boselli et al. (21), and Lodise et al. (20), were used. The validation cohort of Roberts et al. (27) was used.
FIG 2
FIG 2
Structural mathematical models and associated differential equations. X1 and X2 are the amounts of piperacillin (in milligrams) in the central and peripheral compartments, respectively. R(1) represents the infusion of piperacillin. Cl (in liters per hour) is the clearance, and Vc is the volume of the central compartment (in liters). Vmax is the maximum rate of clearance by the Michaelis-Menten clearance mechanism (in milligrams per hour), and Km is the concentration of piperacillin where clearance by the Michaelis-Menten clearance mechanism is half maximal (in milligrams per liter). kcp and kpc are the first-order intercompartmental rate constants. Cls, fraction of piperacillin clearance due to creatinine clearance (in liters per hour); Cli, clearance due to nonrenal means (in liters per hour); Vi, volume of the central compartment not related to body mass (in liters); Vs, volume of the central compartment proportional to body mass (in liters).
FIG 3
FIG 3
Observed-versus-predicted piperacillin concentrations for the in silico validation cohort using 1, 2, 3, or 6 measurements to determine the predicted postdose piperacillin concentrations after 24 h of therapy. The data points (●), linear regression (solid line), and unity (gray dashed line) are shown (bias is the mean weighted prediction error [mg/liter]; precision is the bias-adjusted squared prediction error [mg2/liter2]).
FIG 4
FIG 4
Piperacillin concentration-time profiles for eight validation patients generated from six observed piperacillin concentrations during the first dosing interval. Observed data entered into the software package (●) and observed data unknown to the software package (○) are shown. The predicted piperacillin concentration-time profiles are indicated by the solid lines.
FIG 5
FIG 5
Comparison of the impact of entering one, two, three, or six known first-dose piperacillin concentrations into the dose optimization software on predicted piperacillin dosage for patients actually administered piperacillin (4 g). Each symbol represents the value for an individual patient, and the black lines represent the mean values for the groups of patients.
FIG 6
FIG 6
Predicted piperacillin concentration-time profiles for patients 1 and 8. The observed data entered into the software package (●) and the predicted piperacillin concentration (solid line) are shown. At the top of each graph, each arrowhead represents an administered dose (doses administered prior to individualization [all bolus doses] [▼] and doses administered following individualization [administration over 30 min for bolus doses] [▽]). The therapeutic drug target was a trough piperacillin concentration of 13.6 mg/liter.

References

    1. Vincent J-L, Sakr Y, Sprung CL, Ranieri VM, Reinhart K, Gerlach H, Moreno R, Carlet J, Le Gall J-R, Payen D. 2006. Sepsis in European intensive care units: results of the SOAP study. Crit. Care Med. 34:344–353. 10.1097/01.CCM.0000194725.48928.3A - DOI - PubMed
    1. Martin GS, Mannino DM, Eaton S, Moss M. 2003. The epidemiology of sepsis in the United States from 1979 through 2000. N. Engl. J. Med. 348:1546–1554. 10.1056/NEJMoa022139 - DOI - PubMed
    1. Kollef MH. 1999. Inadequate antimicrobial treatment of infections: a risk factor for hospital mortality among critically ill patients. Chest 115:462–474. 10.1378/chest.115.2.462 - DOI - PubMed
    1. Kumar A, Roberts D, Wood KE, Light B, Parrillo JE, Sharma S, Suppes R, Feinstein D, Zanotti S, Taiberg L, Gurka D, Kumar A, Cheang M. 2006. Duration of hypotension before initiation of effective antimicrobial therapy is the critical determinant of survival in human septic shock. Crit. Care Med. 34:1589–1596. 10.1097/01.CCM.0000217961.75225.E9 - DOI - PubMed
    1. Roberts JA, Lipman J. 2006. Antibacterial dosing in intensive care: pharmacokinetics, degree of disease and pharmacodynamics of sepsis. Clin. Pharmacokinet. 45:755–773. 10.2165/00003088-200645080-00001 - DOI - PubMed

Publication types

MeSH terms

LinkOut - more resources