Review
. 2014 Jun 13;289(24):16615-23.
doi: 10.1074/jbc.R114.563148. Epub 2014 May 5.

The pyruvate dehydrogenase complexes: structure-based function and regulation

Affiliations
Review

The pyruvate dehydrogenase complexes: structure-based function and regulation

Mulchand S Patel et al. J Biol Chem. .

Abstract

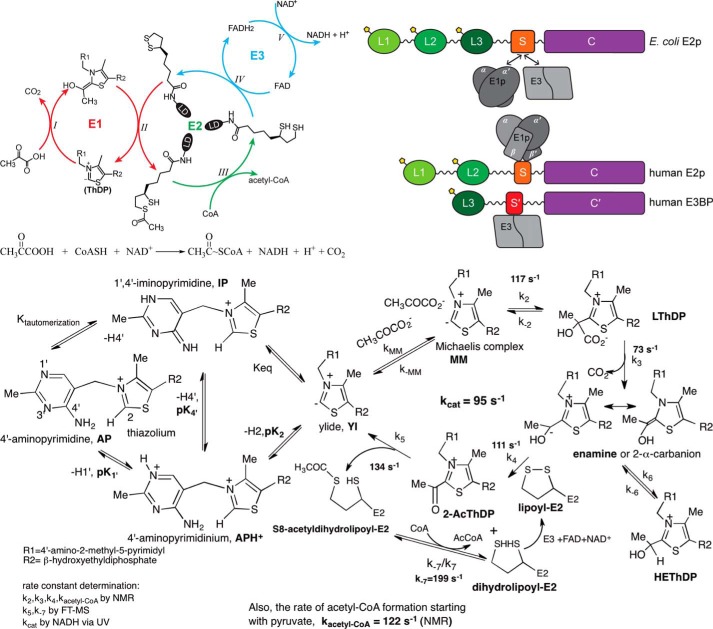
The pyruvate dehydrogenase complexes (PDCs) from all known living organisms comprise three principal catalytic components for their mission: E1 and E2 generate acetyl-coenzyme A, whereas the FAD/NAD(+)-dependent E3 performs redox recycling. Here we compare bacterial (Escherichia coli) and human PDCs, as they represent the two major classes of the superfamily of 2-oxo acid dehydrogenase complexes with different assembly of, and interactions among components. The human PDC is subject to inactivation at E1 by serine phosphorylation by four kinases, an inactivation reversed by the action of two phosphatases. Progress in our understanding of these complexes important in metabolism is reviewed.

Keywords: Covalent Regulation; Enzyme Catalysis; Protein-Protein Interaction; Pyruvate Dehydrogenase Complex (PDC); Pyruvate Dehydrogenase Kinase (PDC Kinase).


Figures

FIGURE 1.
FIGURE 1.
Overall PDC reactions, E2 and E3BP domain structures, and stepwise E1 reactions. Top left, reaction mechanism of the pyruvate dehydrogenase complex. Three catalytic components work sequentially, catalyzing the oxidative decarboxylation of pyruvate with the formation of acetyl-CoA, CO2, and NADH (H+). The reaction catalyzed by E1 is in red; the reaction catalyzed by E2 is in green; and that catalyzed by E3 is in blue. Top right, schematic representation of the domain structure of the E2ec, E2-h, and E3BP, comprising from the N-terminal end 1–3 LDs subunit-binding domain (PSBD or S) to which the E1 and E3 components are bound, and C-terminal catalytic domain (C or C′). Bottom, stepwise mechanism of PDHec reactions: right, tautomers and ionization states of ThDP; left, all kinetic constants were obtained for PDCec using methods listed in the lower left-hand side of the figure, and all rate constants are derived from pre-steady experiments with the exception of k7/k−7 (reproduced from Ref. 73).
FIGURE 2.
FIGURE 2.
Crystal structures of E1 and E3 from E. coli and human. Top, ribbon diagrams illustrating structural differences between functional homodimeric and heterotetrameric E1 enzymatic assemblies from bacterial (E. coli), and mammalian (human) sources, respectively. Left, the homodimeric assembly from E. coli (reproduced from Ref. with permission, Protein Data Bank (PDB) code 1L8A). Right, the heterotetrameric assembly from human (modified from Ciszak et al. (Ref. , PDB code 1NI4). The two figures are on the same scale and shown in the same orientation after least squares alignment based on the cofactors (ThDP) and structurally matching α carbons. The ThDP cofactors are shown in a space-filling representation. Bottom, ribbon diagrams illustrating structures of E3 functional dimers from bacterial E3ec (left) and human E3h (right) sources. In both the left and the right figures, one of the subunits is shown in blue and the other is shown in green, whereas the FAD cofactors are shown in a space-filling representation. The structure of the E3h dimer is shown in subcomplex with the E3-binding domain of E3 (in red). The bottom of this figure is reproduced from Ref. for E3ec (PDB code: 4JDR) and from Ref. for E3h (PDB code: 1ZY8).
FIGURE 3.
FIGURE 3.
Hydrogen deuterium exchange-MS analysis of the interaction loci of 3-lip E2ec and E3ec. Top figure, butterfly plot representing average relative deuterium incorporation percentage (y axis) (deuterons exchanged/maximum exchangeable amides × 100) of peptic fragments from 3-lip E2ec (x axis, listed from N to C terminus) in the absence of E3ec (top) and in the presence of E3ec (bottom). Bottom figure, difference plot showing deuterium incorporation changes in peptic fragments of 3-lip E2ec in the absence and presence of E3ec (reproduced from Ref. 39).

References

    1. Reed L. J. (2001) A trial of research from lipoic acid to α-keto acid dehydrogenase complexes. J. Biol. Chem. 276, 38329–38336 - PubMed
    1. Perham R. N. (1991) Domains, motifs, and linkers in 2-oxo acid dehydrogenase multienzyme complexes: a paradigm in the design of a multifunctional protein. Biochemistry 30, 8501–8512 - PubMed
    1. Patel M. S., Roche T. E. (1990) Molecular biology and biochemistry of pyruvate dehydrogenase complexes. FASEB J. 4, 3224–3233 - PubMed
    1. Patel M. S., Korotchkina L. G. (2003) The biochemistry of the pyruvate dehydrogenase complex. Biochem. Mol. Biol. Educ. 31, 5–15
    1. Korotchkina L. G., Sidhu S., Patel M. S. (2006) Characterization of testis-specific isoenzyme of human pyruvate dehydrogenase. J. Biol. Chem. 281, 9688–9696 - PubMed

Publication types

Substances