. 2014 May 5;9(5):e96691.
doi: 10.1371/journal.pone.0096691. eCollection 2014.

Apamin does not inhibit human cardiac Na+ current, L-type Ca2+ current or other major K+ currents

Affiliations

Apamin does not inhibit human cardiac Na+ current, L-type Ca2+ current or other major K+ currents

Chih-Chieh Yu et al. PLoS One. .

Erratum in

  • PLoS One. 2014;9(7):e104445.

Abstract

Background: Apamin is commonly used as a small-conductance Ca2+-activated K+ (SK) current inhibitor. However, the specificity of apamin in cardiac tissues remains unclear.

Objective: To test the hypothesis that apamin does not inhibit any major cardiac ion currents.

Methods: We studied human embryonic kidney (HEK) 293 cells that expressed human voltage-gated Na+, K+ and Ca2+ currents and isolated rabbit ventricular myocytes. Whole-cell patch clamp techniques were used to determine ionic current densities before and after apamin administration.

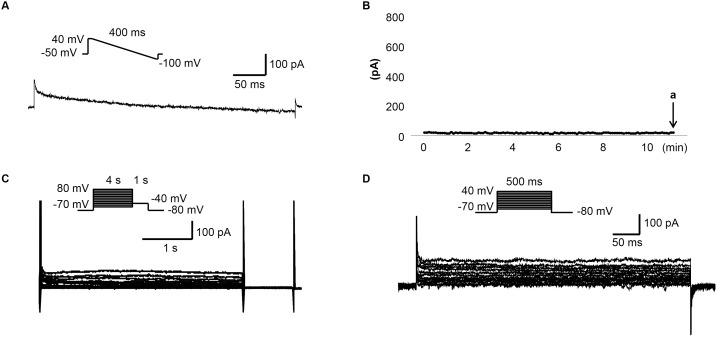
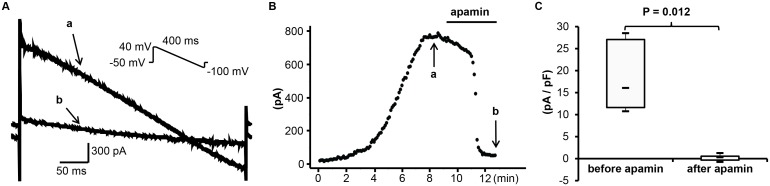
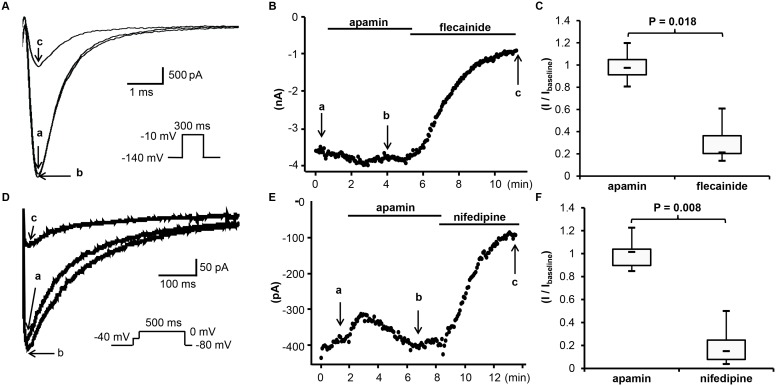
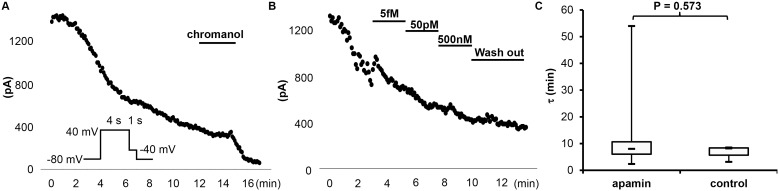
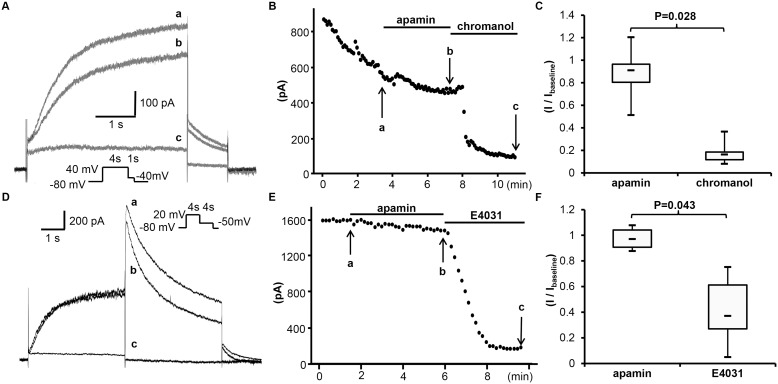
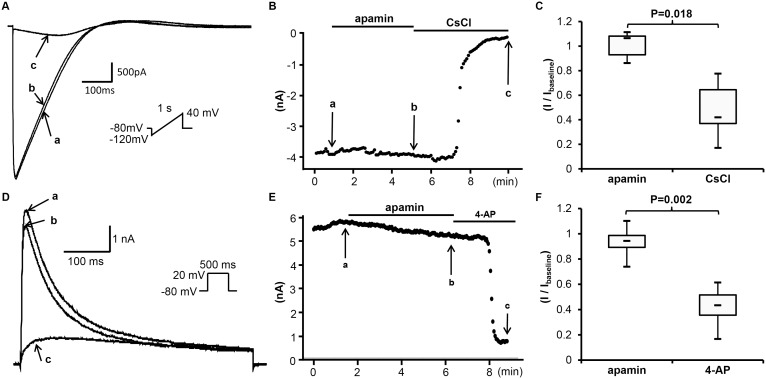
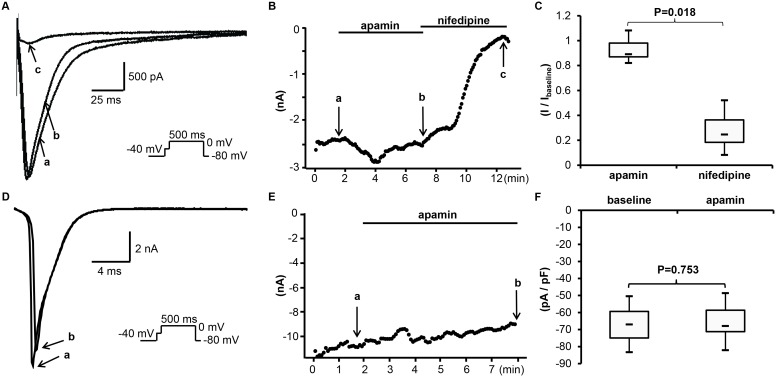
Results: Ca2+ currents (CACNA1c+CACNB2b) were not affected by apamin (500 nM) (data are presented as median [25th percentile;75th percentile] (from -16 [-20;-10] to -17 [-19;-13] pA/pF, P = NS), but were reduced by nifedipine to -1.6 [-3.2;-1.3] pA/pF (p = 0.008). Na+ currents (SCN5A) were not affected by apamin (from -261 [-282;-145] to -268 [-379;-132] pA/pF, P = NS), but were reduced by flecainide to -57 [-70;-47] pA/pF (p = 0.018). None of the major K+ currents (IKs, IKr, IK1 and Ito) were inhibited by 500 nM of apamin (KCNQ1+KCNE1, from 28 [20]; [37] to 23 [18]; [32] pA/pF; KCNH2+KCNE2, from 28 [24]; [30] to 27 [24]; [29] pA/pF; KCNJ2, from -46 [-48;-40] to -46 [-51;-35] pA/pF; KCND3, from 608 [505;748] to 606 [454;684]). Apamin did not inhibit the INa or ICaL in isolated rabbit ventricular myocytes (INa, from -67 [-75;-59] to -68 [-71;-59] pA/pF; ICaL, from -16 [-17;-14] to -14 [-15;-13] pA/pF, P = NS for both).

Conclusions: Apamin does not inhibit human cardiac Na+ currents, L-type Ca2+ currents or other major K+ currents. These findings indicate that apamin is a specific SK current inhibitor in hearts as well as in other organs.


Conflict of interest statement

Competing Interests: The authors have declared that no competing interests exist.

Figures

Figure 1
Figure 1. The endogenous K+ currents of HEK 293 cells.
(A) The representative tracing obtained with ramp protocol shown in the inset at time point indicated by arrow a in (B). The pipette and bath solutions are the same as the ones used in measuring I SK2. (B) The time course of I SK2 measured at 0 mV. (C) The representative tracings obtained with the pulse protocol shown in the inset with the pipette and bath solution used in measuring I Ks. (D) The representative tracings obtained with the pulse protocol shown in the inset with the pipette and bath solutions used in measuring I Kr, I K1 and I to.
Figure 2
Figure 2. Effect of apamin on I SK2 in transfected HEK 293 cells.
(A) The representative I SK2 tracings obtained by the descending voltage ramp protocol shown in the inset before (a) and after (b) apamin at time points indicated by arrows a and b in (B). (B) The time course of I SK2 at 0 mV. (C) The summary of current density before and after apamin.
Figure 3
Figure 3. Effects of apamin on I Na and I Ba in transfected HEK 293 cells.
(A) The representative I Na tracings obtained by the pulse protocol shown in the inset before apamin (a), after apamin (b) and after flecainide (c) at time points indicated by arrows a through c, respectively, in (B). (B) The time course of peak I Na measured at –10 mV. (C) The summary of drug effects normalized to baseline. (D) The representative I Ba tracings at 0 mV obtained by the pulse protocol shown in the inset before apamin (a), after apamin (b) and after nifedipine (c) at time points indicated by arrows a through c, respectively, in (E). (E) The time course of peak I Ba measured at 0 mV. (F) The summary of drug effects normalized to baseline.
Figure 4
Figure 4. Effects of different concentrations of apamin on the rundown course of I Ks in transfected HEK 293 cells.
(A) An observation experiment without apamin treatment showing time-dependent rundown, obtained with the pulse protocol shown in the inset with chromanol 293B at the end. (B) The representative time course of I Ks treated with different concentrations of apamin. (C) The time constant (τ) of the rundown curve with (n = 10) and without (n = 3) apamin.
Figure 5
Figure 5. Effects of apamin on I Ks and I Kr in transfected HEK 293 cells.
(A) The representative tracings of I Ks obtained by pulse protocol shown in the inset before apamin (a), after apamin (b) and after chromanol (c) at time points indicated by arrows a through c, respectively, in (B). (B) The time course of peak I Ks at 40 mV. (C) The summary of drug effects normalized to baseline. (D) The representative tracings of I Kr obtained by a pulse protocol shown in the inset before apamin (a), after apamin (b) and after E4031 (c) at time points indicated by arrows a through c in (E). (E) The time course of peak I Kr at 20 mV. (F) The summary of drug effects normalized to baseline.
Figure 6
Figure 6. Effects of apamin on I K1 and I to in transfected HEK 293 cells.
(A) The representative tracings of I K1 by ascending voltage ramp protocol shown in the inset before apamin (a), after apamin (b) and after CsCl (c) at time points indicated by arrows a through c, respectively, in (B). (B) The time course of I K1 at –100 mV. (C) The summary of drug effects normalized to baseline. (D) The representative tracings of I to obtained by a pulse protocol shown in the inset before apamin (a), after apamin (b) and after 4-AP (c) at time points indicated by arrows a through c, respectively, in (E). (E) The time course of peak I to at 20 mV. (F) The summary of drug effects normalized to baseline.
Figure 7
Figure 7. Effects of apamin on I Ca and I Na in rabbit cardiomyocytes.
(A) The representative I Ca tracings obtained by a pulse protocol shown in the inset before apamin (a), after apamin (b) and after nifedipine (c) at time points indicated by arrows a through c, respectively, in (B). (B) The time course of peak I Ca measured at 0 mV. (C) The summary of drug effects normalized to baseline. (D) The representative tracings of I Na obtained by a pulse protocol shown in the inset before apamin (a), after apamin (b) at time points indicated by arrows a and b, respectively, in (E). (E) The time course of peak I Na at –40 mV. (F) The summary of current densities before and after apamin.

Similar articles

Cited by

References

    1. Allen D, Bond CT, Lujan R, Ballesteros-Merino C, Lin MT, et al. (2011) The SK2-long isoform directs synaptic localization and function of SK2-containing channels. Nat Neurosci 14: 744–749. - PMC - PubMed
    1. Kohler M, Hirschberg B, Bond CT, Kinzie JM, Marrion NV, et al. (1996) Small-conductance, calcium-activated potassium channels from mammalian brain. Science 273: 1709–1714. - PubMed
    1. Castle NA, Haylett DG, Jenkinson DH (1989) Toxins in the characterization of potassium channels. Trends Neurosci 12: 59–65. - PubMed
    1. Ishii TM, Maylie J, Adelman JP (1997) Determinants of apamin and d-tubocurarine block in SK potassium channels. J Biol Chem 272: 23195–23200. - PubMed
    1. Xu Y, Tuteja D, Zhang Z, Xu D, Zhang Y, et al. (2003) Molecular identification and functional roles of a Ca2+-activated K+ channel in human and mouse hearts. J Biol Chem 278: 49085–49094. - PubMed

Publication types

MeSH terms