. 2014 May 15;5(9):2807-19.
doi: 10.18632/oncotarget.1921.

Oncolytic reovirus preferentially induces apoptosis in KRAS mutant colorectal cancer cells, and synergizes with irinotecan

Affiliations

Oncolytic reovirus preferentially induces apoptosis in KRAS mutant colorectal cancer cells, and synergizes with irinotecan

Radhashree Maitra et al. Oncotarget. .

Abstract

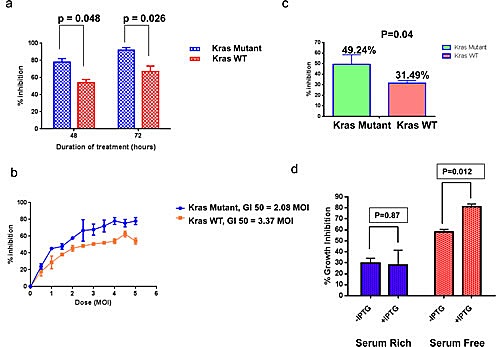
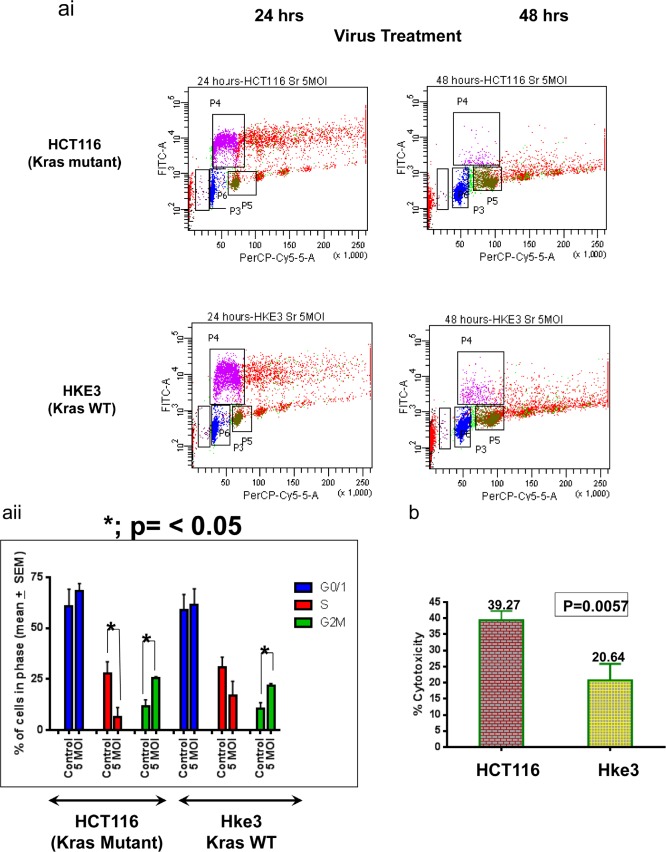
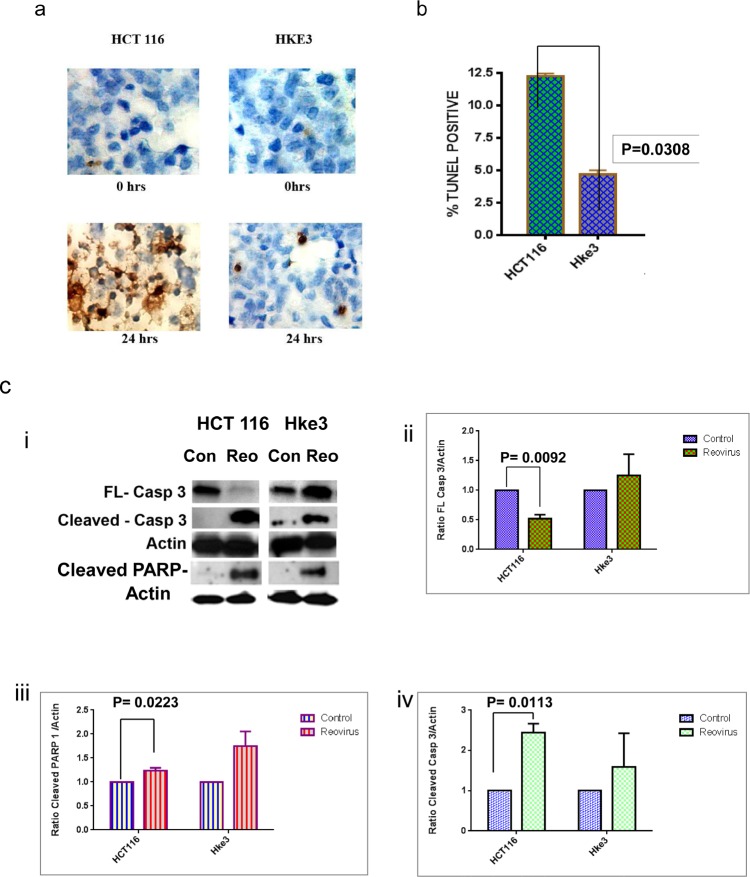
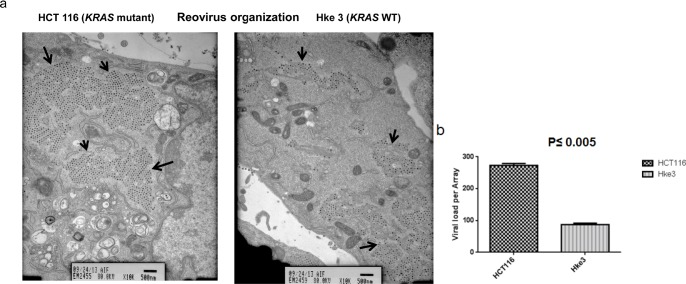
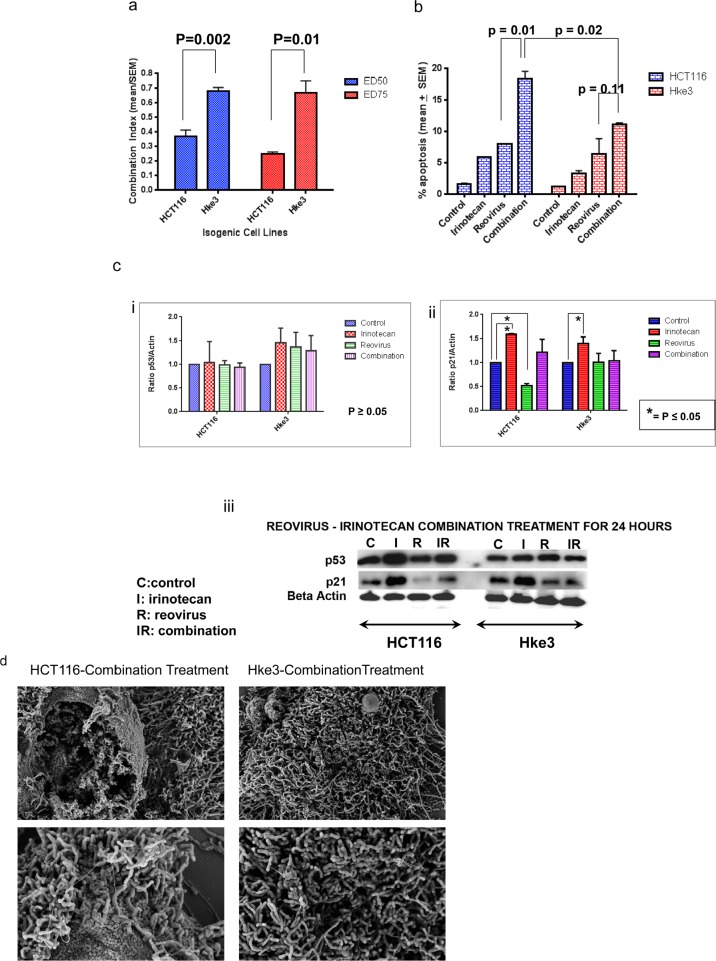
Reovirus is a double stranded RNA virus, with an intrinsic preference for replication in KRAS mutant cells. As 45% of human colorectal cancers (CRC) harbor KRAS mutations, we sought to investigate its efficacy in KRAS mutant CRC cells, and examine its impact in combination with the topoisimerase-1 inhibitor, irinotecan. Reovirus efficacy was examined in the KRAS mutant HCT116, and the isogenic KRAS WT Hke3 cell line, and in the non-malignant rat intestinal epithelial cell line. Apoptosis was determined by flow cytometry and TUNEL staining. Combination treatment with reovirus and irintoecan was investigated in 15 CRC cell lines, including the HCT116 p21 isogenic cell lines. Reovirus preferentially induced apoptosis in KRAS mutant HCT116 cells compared to its isogenic KRAS WT derivative, and in KRAS mutant IEC cells. Reovirus showed a greater degree of caspase 3 activation with PARP 1 cleavage, and preferential inhibition of p21 protein expression in KRAS mutant cells. Reovirus synergistically induced growth inhibition when combined with irinotecan. This synergy was lost upon p21 gene knock out. Reovirus preferentially induces apoptosis in KRAS mutant colon cancer cells. Reovirus and irinotecan combination therapy is synergistic, p21 mediated, and represents a novel potential treatment for patients with CRC.


Figures

Figure 1a
Figure 1a
Effect of reovirus on the KRAS isogenic cell lines. There was a preferential sensitivity to reovirus in the KRAS mutant HCT116 cell line as compared to the KRAS WT Hke3 cell line. At 48 hours, the mean + SEM growth inhibition was 78.08% (+ 4.11%) for the KRAS mutant cell line vs. 54.14% (+ 3.59%) for the KRAS WT cell line, with a p value of 0.048. Similarly, at 72 hours, the mean (+ SEM) growth inhibition was 91.78% (3.08%) for the KRAS mutant cell line as compared to 67.12% (6.32%) for the KRAS WT cell line, with a p value of 0.026. b Effect of reovirus at range of doses between MOI 0.5-5 in KRAS mutant HCT116 and KRAS WT Hke3 cell lines. Data presented as % inhibition (mean + SEM) at each of the doses. A regression curve was ascertained and using the curve so generated, the GI50 was derived to be 2.08 MOI for KRAS mutant HCT116 and 3.37 MOI for Hke3. c. Growth inhibition patterns in a panel of 13 CRC cell lines. Reovirus induced greater (49.24 + 9.09%) growth inhibition in 5 KRAS mutated, than the 8 KRAS wild type (31.49 + 2.6%) cell lines at 72 hours at a dose of 2.5 MOI with significant p value of 0.04. All values reported as mean + SEM.d. MTT assay confirms reovirus activity under KRAS induced and un-induced condition confirming greater activity under KRAS induced situation. Reovirus induces greater growth inhibition in IEC-iKRAS rat epithelial cell line and the inhibition is significant (p= 0.012) in the serum free environment.
Figure 2ai
Figure 2ai
Flow cytometric analysis of HCT116 and Hke3 at 24 and 48 hours of treatment. The FITC labeled BrdU incorporated cells indicates the S phase population which decreases with increase of time. The effect is most pronounced for KRAS mutated HCT116 cells. aii. A graphical representation of the cell cycle distribution upon treatment with 5 MOI reovirus for 48 hours. 10,000 events were recorded and compared between treated and untreated population. In HCT116 (KRAS mutant) cells, there is a prominent ablation of S-phase population upon reovirus infection (P= 0.008), but not for KRAS WT cells. A significant G2M arrest was observed in both the cell lines (p= 0.0133 for HCT116, and p=0.028 for Hke3). b. LDH cytotoxicity assay as a measurement of cell membrane destabilization post reovirus infection. Cells were treated for 72 hours at 2MOI and LDH released to the culture media was quantified. The percent cytotoxicity was significantly higher (39.27% ± 2.9%) for HCT116 as compared to (20.64%± 5.2%) for Hke3 (p= 0.0057). All values are mean + SEM.
Figure 3a
Figure 3a
A microscopic photograph of TUNEL stained cells at 0 and 24hrs post treatment. The brown stain represents the apoptotic cells which are higher for KRAS mutated HCT116 cells. b. A graphical representation of the prevalence of TUNEL positive apoptotic cells at 24 hours post reovirus treatment in HCT116 and Hke3 cells. The graph shows the mean from two independent experiment with 12.22 ±0.24% (mean ± SEM) apoptotic TUNEL positive cells in HCT116 and Hke3 cells 4.66 ± 0.345% (mean ±SEM) cells in Hke3. A two tail t test is employed to generate the p value of 0.03.c. i.Photographic representation of expression of full length and cleaved caspase 3 proteins, and cleaved PARP-1 in control and reovirus treated HCT116 and Hke3 cells as quantified by western blot analysis. The cells were treated at 5MOI and harvested at 48 hours post treatment. 60 ugm of protein was loaded in each lane to quantitatively follow the expression of the proteins. A prominent cleavage of full length caspase 3 along with enhanced cleaved PARP-1 is noted in reovirus treated HCT116 cells. ii-iv. The adjoining graphs represent the relative densitometry of the three proteins normalized to ß-Actin in control and reovirus treated HCT116 and Hke3 cells. The effect of down regulation of full length caspase 3 and up regulation of cleaved PARP-1 and cleaved caspase 3 is significant in reovirus treated KRAS mutant HCT116 cells only. The graph shows the mean protein densities from two independent experiments and a two tailed t test is employed to generate the p value.
Figure 4a
Figure 4a
Transmission electron micrograph of HCT116 and Hke3 cells upon 5MOI reovirus treatment for 48 hours. The KRAS mutant HCT116 cells show a much greater formation of viral crystalline Arrays (VCA's) indicative of the effective generation of infection competent virion particles. The images were photographed under 10K magnification. b. Graphical representation of the number of viral particles per array in HCT116 and Hke3 cells treated with 5MOI reovirus at for 48 hours. Three independent arrays were counted per cell line. A quantitative analysis of count of viral particle per array indicated 272.67 ± 3.71 (mean ± SEM) particles in HCT116 and 87±2.65 (mean ± SEM) particles in Hke3 cells. A significant p value of p≤0.005 was observed.
Figure 5a
Figure 5a
Combination index of reovirus and irinotecan administration in KRAS mutant HCT116 as compared to KRAS wild type isogenic Hke3 cells at 50% and 75% growth inhibition. While synergy is observed in both cell lines (CI<1), a significant difference is detected in the CI between the two cell lines at the respective effective doses (ED; p=0.002 at ED50 and p=0.01at ED75 respectively).b. FACS analysis for quantitative assessment of apoptosis. The combination group showed a greater degree of apoptosis than single agent reovirus (p=0.01) in HCT116, while in the KRAS WT Hke3 cells there was no improvement as compared to single agent reovirus (p=0.11; Figure 5b). Moreover, the apoptosis in the combination was significantly higher in the KRAS mutant cells at 18.44 + 1.07 (mean + SEM) than the KRAS WT cells, at 11.14 + 0.16 (mean + SEM), with a p value of 0.02. c. Western blot assay to determine the expression of p21 and p53 proteins. HCT116 and Hke3 cells were treated with 5MOI reovirus and 2 uM irinotecan as single agent and in combination for 24 hours. Cells were harvested and 50 ugm were loaded per lane. The blot was probed with β-actin to confirm the equal protein load per lane. The adjoining graphs represents the relative densitometry of p53 and p21 proteins normalized to ß-Actin in control, irinotecan, reovirus and combination treatment of HCT116 and Hke3 cells at 48 hours. The expression of p53 was not significant in either of the cell lines but p21 showed a significant upregulation in irinotecan treated groups in both the cell lines where as significant downregulation only in reovirus treated KRAS mutant HCT 116 cells. The graph shows the mean protein densities from two independent experiments and a two tailed t test is employed to generate the p value. d. Scanning electron micrograph of HCT116 and Hke3 cells upon combination treatment at 5K magnification (upper panel) and 10K magnification in the lower panel. More prominent perturbation is observed in KRAS mutant HCT116 when compared to KRAS wildtype Hke3 cells.

References

    1. Siegel R, DeSantis C, Virgo K, Stein K, Mariotto A, Smith T, Cooper D, Gansler T, Lerro C, Fedewa S, Lin C, Leach C, Cannady RS, Cho H, Scoppa S, Hachey M, et al. Cancer treatment and survivorship statistics, 2012. CA Cancer J Clin. 2012;62(4):220–241. - PubMed
    1. East JE, Dekker E. Colorectal cancer diagnosis in 2012: A new focus for CRC prevention-more serration, less inflammation. Nat Rev Gastroenterol Hepatol. 2013 - PubMed
    1. Sei S, Mussio JK, Yang QE, Nagashima K, Parchment RE, Coffey MC, Shoemaker RH, Tomaszewski JE. Synergistic antitumor activity of oncolytic reovirus and chemotherapeutic agents in non-small cell lung cancer cells. Mol Cancer. 2009;8:47. - PMC - PubMed
    1. Shmulevitz M, Marcato P, Lee PW. Unshackling the links between reovirus oncolysis, Ras signaling, translational control and cancer. Oncogene. 2005;24(52):7720–7728. - PubMed
    1. Marcato P, Shmulevitz M, Lee PW. Connecting reovirus oncolysis and Ras signaling. Cell Cycle. 2005;4(4):556–559. - PubMed

MeSH terms